Open Access Carbon Database for Buildings is Launched by Ramboll
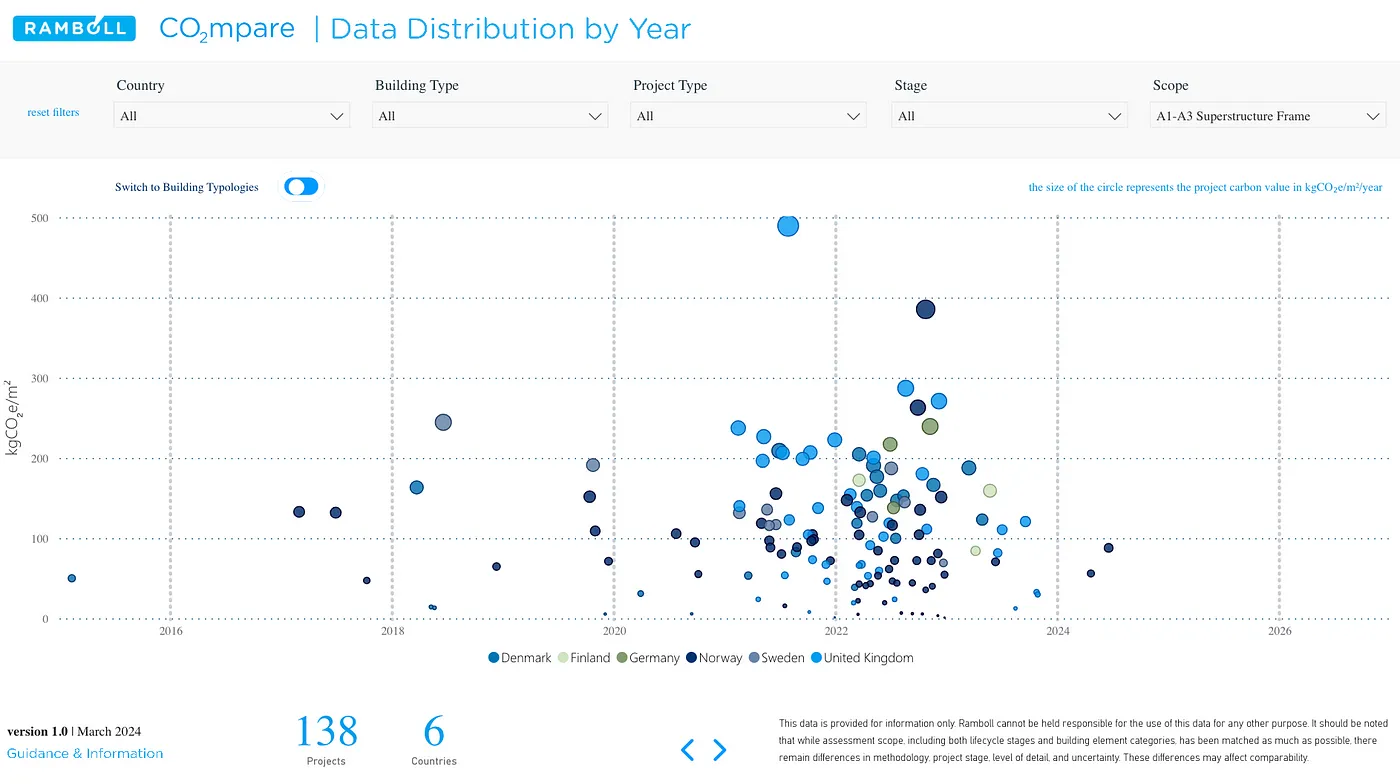
CO2mpare data distribution by Ramboll
Industry and governments can now explore and compare data for carbon emissions across over 130 building projects in six different countries using Ramboll’s carbon assessment database, CO2mpare.
Data Exchange for Improved Buildings
The decarbonization and resilience of the building and construction industry are greatly aided by data. It helps policymakers and the industry make informed decisions by allowing them to compare different building types and establish sustainable benchmarks.
However, there are frequently regional and national disparities in the quantity, quality, and accessibility of data. Furthermore, data harmonisation and standardisation are required to guarantee comparability and compatibility across systems.
Ramboll is now providing the building sector and governments with access to its global dataset of carbon emissions for buildings in recognition of these difficulties.
Although Ramboll is dedicated to providing public access to its data, it understands that these initiatives are only the start of the coordinated efforts required to decarbonize the built environment.
Look into Ramboll CO2mpare
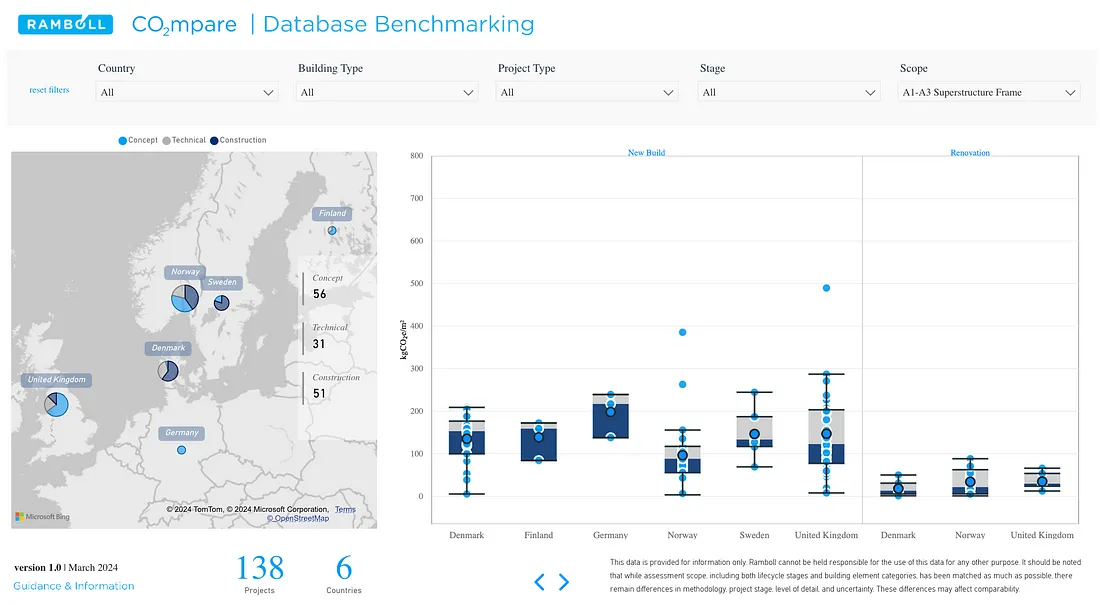
CO2mpare database benchmarking by Ramboll
✅ 138 projects are currently in the database
✅ 10 building typologies are covered in the database
✅ 5 different scopes of the carbon assessment are currently available
An interactive benchmarking tool for understanding the typical carbon for construction projects across various countries, typologies, and project kinds is provided by the CO2mpare database.
The database is designed with the web in mind. Make sure you use your browser to access it for best results.
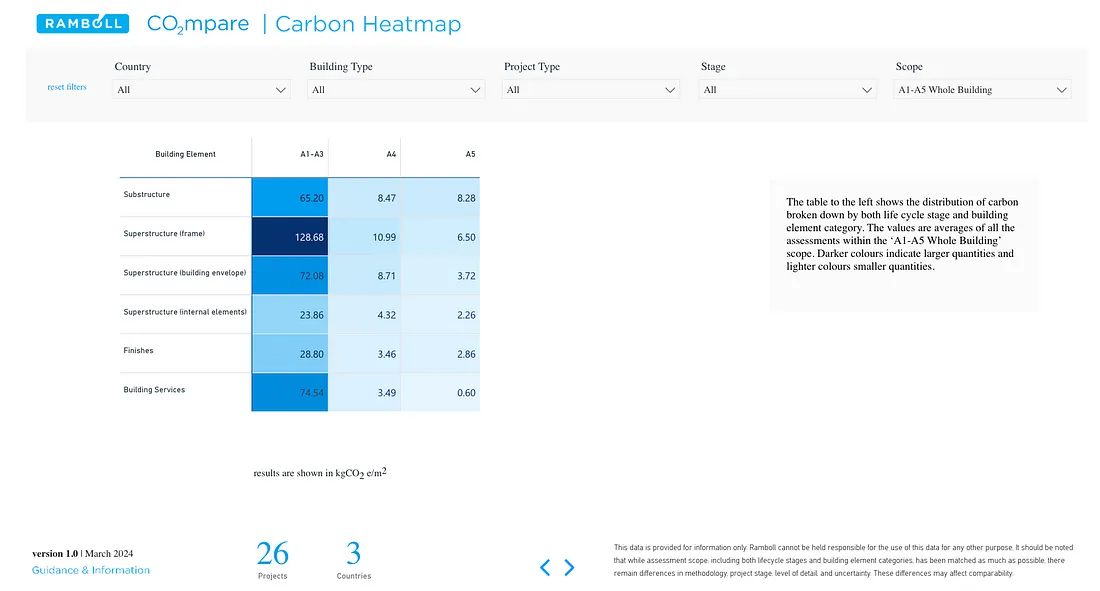
CO2mpare Carbon Heatmap by Ramboll
Which Carbon Assessment Scope Does CO2mpare Use?
Ramboll issued a report last year that outlined the difficulties posed by various carbon measurement techniques. Comparing projects is limited to those with comparable scopes; the more scope, the less matching projects there are. The A1-A3 and A1-A5 life cycle stages are included in the initial CO2mpare release, and options include the superstructure (frame), the entire structure, or the entire building.
A1-A3 and A1-A5: What Do They Mean?
The life cycle stages that are employed follow the modular methodology outlined in EN 15978. Check the below visual representation for more explanation.
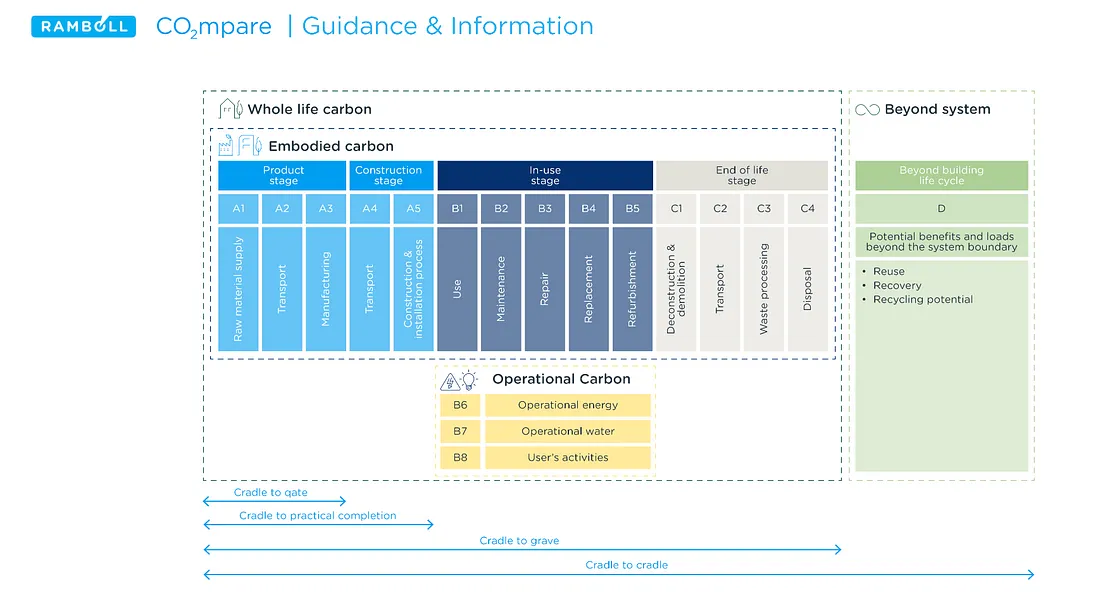
Guidance and Information by CO2mpare
Al-A3, also known as the cradle to gate carbon, is the upfront product carbon. It comprises emissions from the extraction, processing, and transportation of materials. The term “cradle to practical completion carbon” (Al-A5) refers to the total upfront embedded carbon, which also includes emissions from the transportation of goods to the construction site and from construction activities.
What do the Terms “superstructure” (frame), “whole structure” and “whole building” mean?
Ramboll has incorporated particular scope groupings to facilitate comparison:
☑ Superstructure (frame): the structural frame above ground
☑ Whole structure: the structural frame above ground including the substructure
☑ Whole building: the structural frame above ground including the substructure (envelope), superstructure (internal elements), finishes and the Building Services.
Units Used
kgCO,e/m? is the standard unit of measurement in CO2mpare. The area utilized is the Gross Floor Area (GFA) number that has been normalized and adjusted to take into consideration variations in the definition of floor area.
Will Further Information be Provided?
Indeed! Ramboll is expanding the quantity of carbon assessments it performs and is constantly enhancing its technologies to increase efficiency and reliability. New data sets will be added to the CO2mpare database on a regular basis, broadening its coverage and areas of interest.
The information in CO2mpare comes from Ramboll’s carbon assessments.
 Notice of Disclaimer
Ramboll disclaims any liability for any use of the data in CO2mpare that is not intended for informational purposes. While every effort has been made to match scope, it should be noted that discrepancies in approach, project stage, and amount of detail may exist, thereby raising questions about comparability and increasing ambiguity.
Notice of Disclaimer
Ramboll disclaims any liability for any use of the data in CO2mpare that is not intended for informational purposes. While every effort has been made to match scope, it should be noted that discrepancies in approach, project stage, and amount of detail may exist, thereby raising questions about comparability and increasing ambiguity.
First Global Data-driven Open Access Industry Platform
With its interactive interface and a large number of projects across various architectural typologies, CO2mpare is the first open access tool of its kind.
The database incorporates information from many carbon assessment approaches and makes data collecting and comparisons across various typologies and geographical areas easier. Assessing Ramboll’s own carbon footprint throughout its global design portfolio has been made possible thanks in large part to this data.
It aspires to continuously integrate data from most continents with additional scope to expand its worldwide dataset. Initially, it focused on upfront carbon and Northern Europe.
As the database is still being developed, Ramboll would appreciate any comments to help refine it further.
Our Take on This
Ramboll’s open access database facilitates data collection and comparisons across different typologies and regions. By enabling comparisons between various building types and the establishment of sustainable benchmarks, it assists regulators and the industry in making well-informed decisions.
2050 Materials celebrates this launch and supports it by constantly updating our embodied carbon optimizer tool for a simplified LCA in your early design phases.
Sources:
Related articles
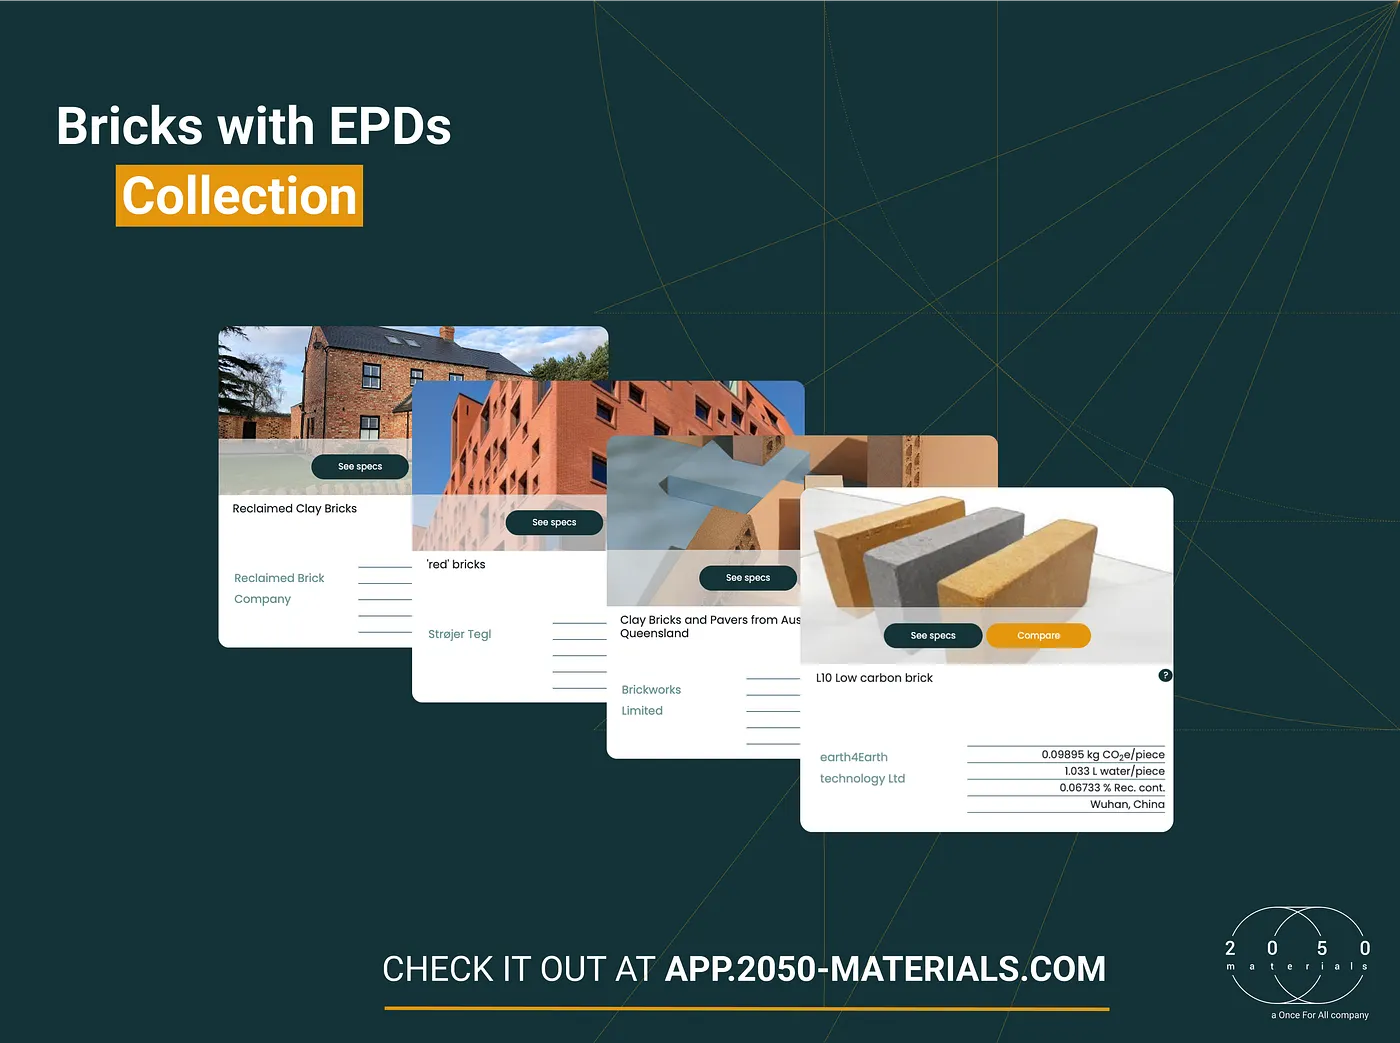
The Most Interesting Brick Products with EPDs on the 2050 Materials Platform
This collection brings together a range of bricks with EPDs listed on the 2050 Materials Platform. They include earth-based bricks, handcrafted bricks, clay bricks, reclaimed bricks, reused clinker bricks, and other specialty brick products.
Read more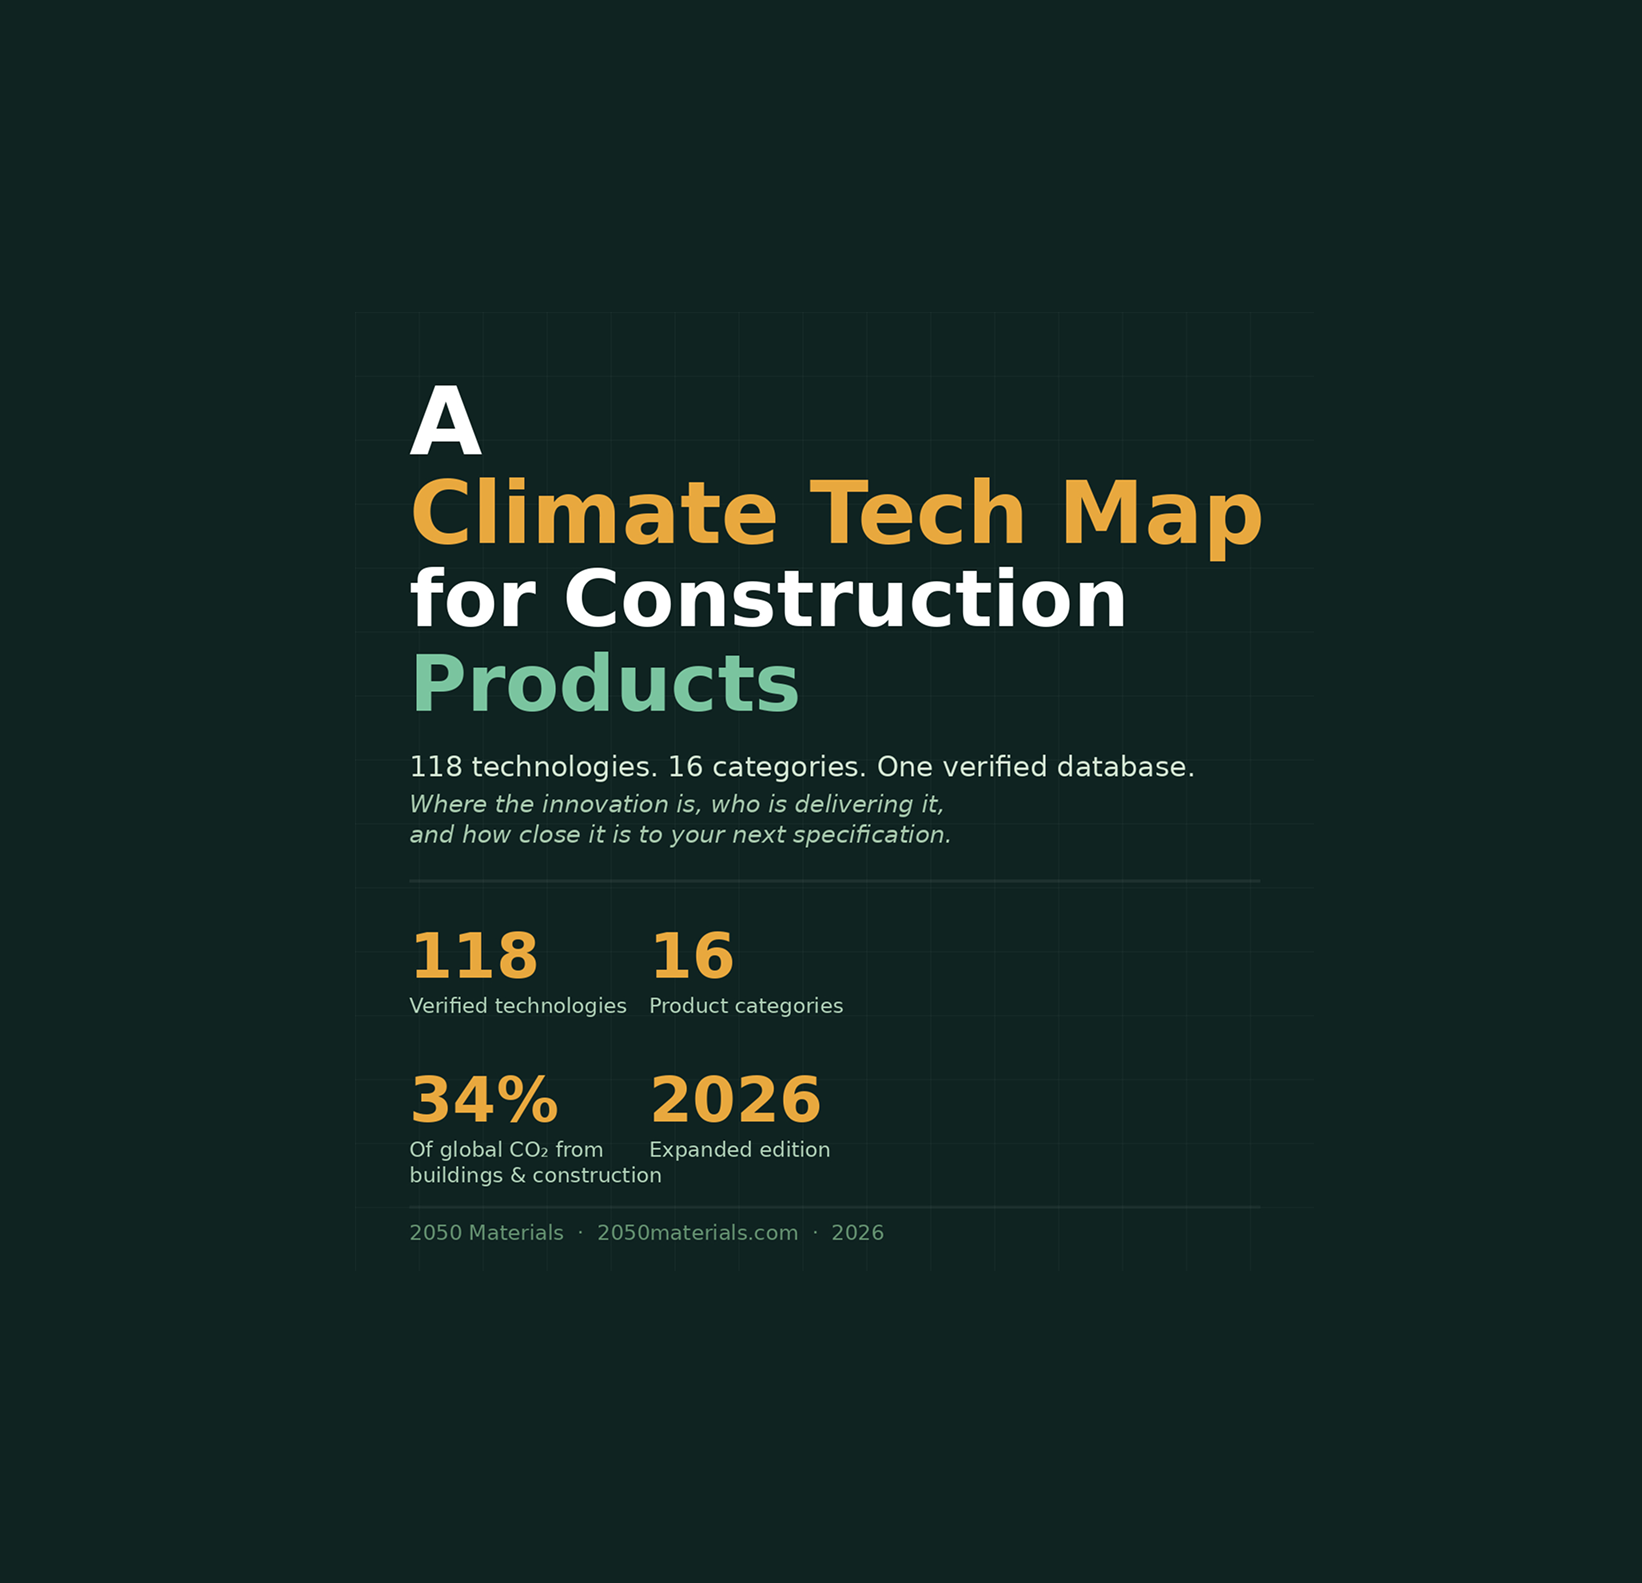
A Climate Tech Map for Construction Products
118 technologies · 16 categories · One verified database. Where the innovation is, who is delivering it, and how close it is to your next specification.
Read more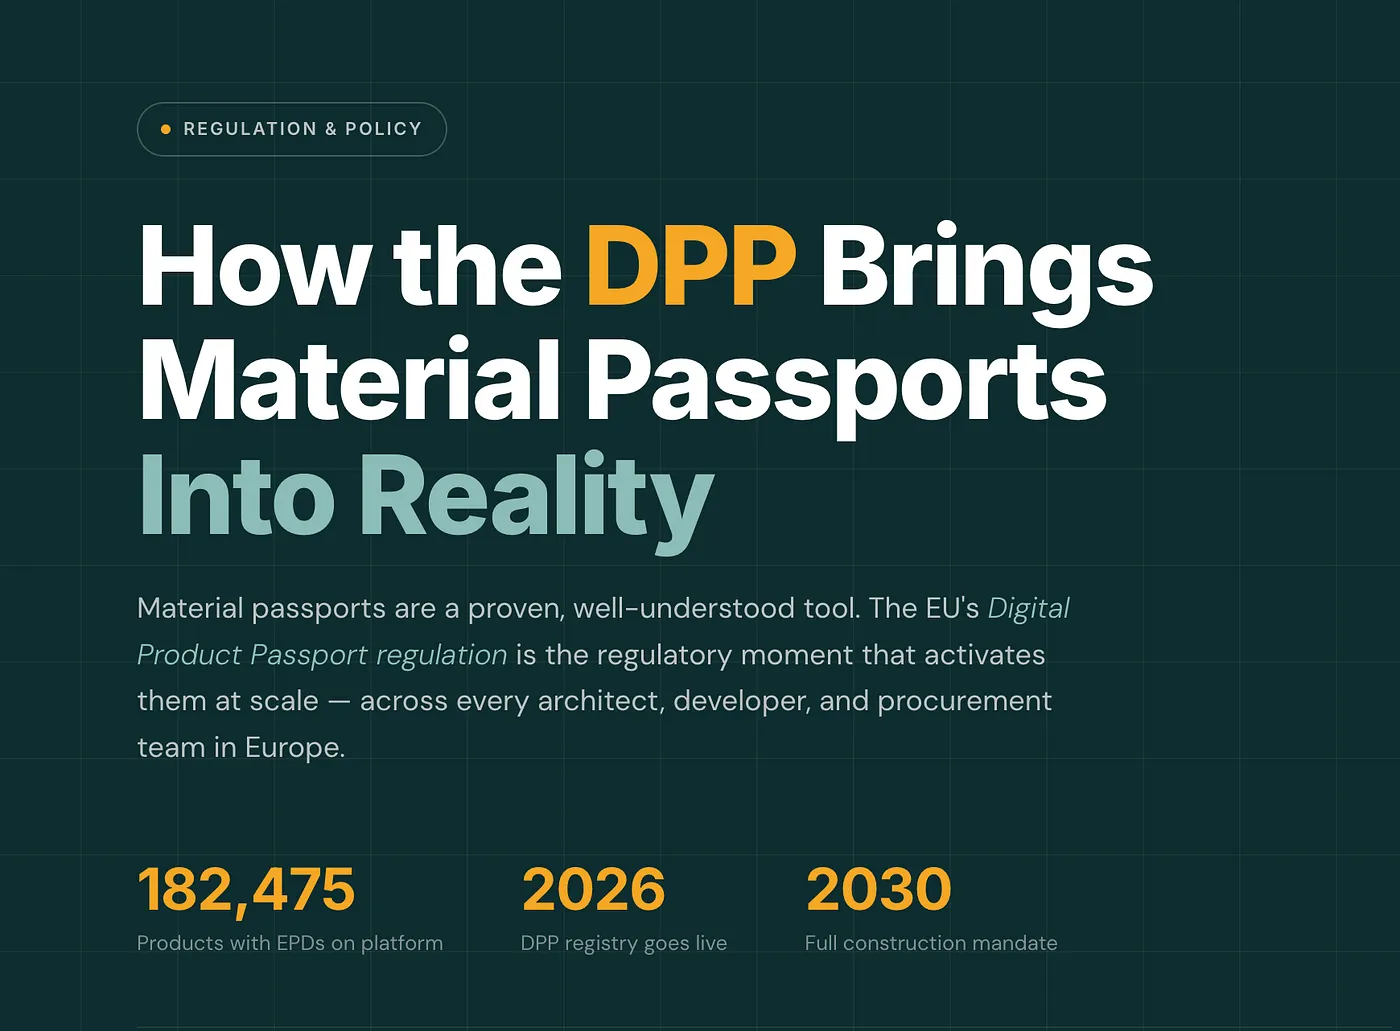
How the Digital Product Passports Bring (Building) Material Passports Into Reality
The EU's Digital Product Passport regulation provides all three simultaneously. A legal mandate across 27 member states. Standardised, machine-readable data requirements defined in law. And a market consequence with real teeth: no compliant passport, no EU market access. The tool hasn't changed. The conditions around it have.
Read more