AECData Python Library Step 2— Get filters and retrieve product data
TL;DR
 We go step by step and explain how to start with the filtering and retrieval of data on aecdata (see code below).
Done with authentication, on with data retrivals
In our last article we talked about how to set up the first lines of code in your Python script, with information about where to store your token, and how to authenticate and initialize your project.
If you missed the last tutorial, make sure to include the following code at the beginning of your script or notebook:
In this article, we’ll be going through how to run your first commands to get filters and then apply those filters to the API to retrieve product data.

Get the field descriptions and the available filters
There’s a lot of data in the 2050 Materials universe (>140,000 products with hundreds of fields each). This means that while using the API to build your application or dashboard, it’s wise to filter the data to what you are looking for.
Retrieve field descriptions
Hint
Retrieving field descriptions programmatically can allow you to show these in your own application without worrying about changes.
If you just want to see the descriptions to understand what exists, our docs may be a better place to look at.
Retrieve filters
Retrieving the available filters is a really nice way to create dynamic filters in your application.
Why filter the data at all…?
For example, if you’re building a dashboard to plot insulation material emissions for products in Europe, you’ll want to apply the relevant filters for product_type, material_type and continent . This will avoid having to make unnecessary API calls and then filter the data, which will always be inherently slower and will hinder user performance.
Applying the filters and making your first data call
After getting the filters and their mappings, we can now create a filters dictionary which we can supply to the get_products function to retrieve the data.
For this example, we will be retrieving all ceramic tiles (product_types = Tiles, material_type_family=Ceramic)
To do that, we create the filter fictionary as below:
And then we provide the filters to the get_products function
Running a print() function will let you see the JSON object returned by the API. If you are working in a notebook and plan on doing anything related to visualizations, grouping and statistics, it may make sense to transform the data to a DataFrame .
Transform the data to a table or DataFrame
To do any sort of transformation, we developed the ProductData class.
This class is designed to manage and manipulate the data fetched from the 2050-materials API. It offers functionalities for converting data between different formats, scaling product data based on units and amounts, and generating plots for product contributions (more on that in our next tutorial, check it out here)
Done, for now!
You’re now set up with aecdata and have extracted a table of data (in the form of a DataFrame).
Have a look at our next article, where we will be diving into how to use that data to run analytics, statistics, plot informative graphs and generally use it to expand whatever you are building…
Stay tuned, and happy coding!
Related articles
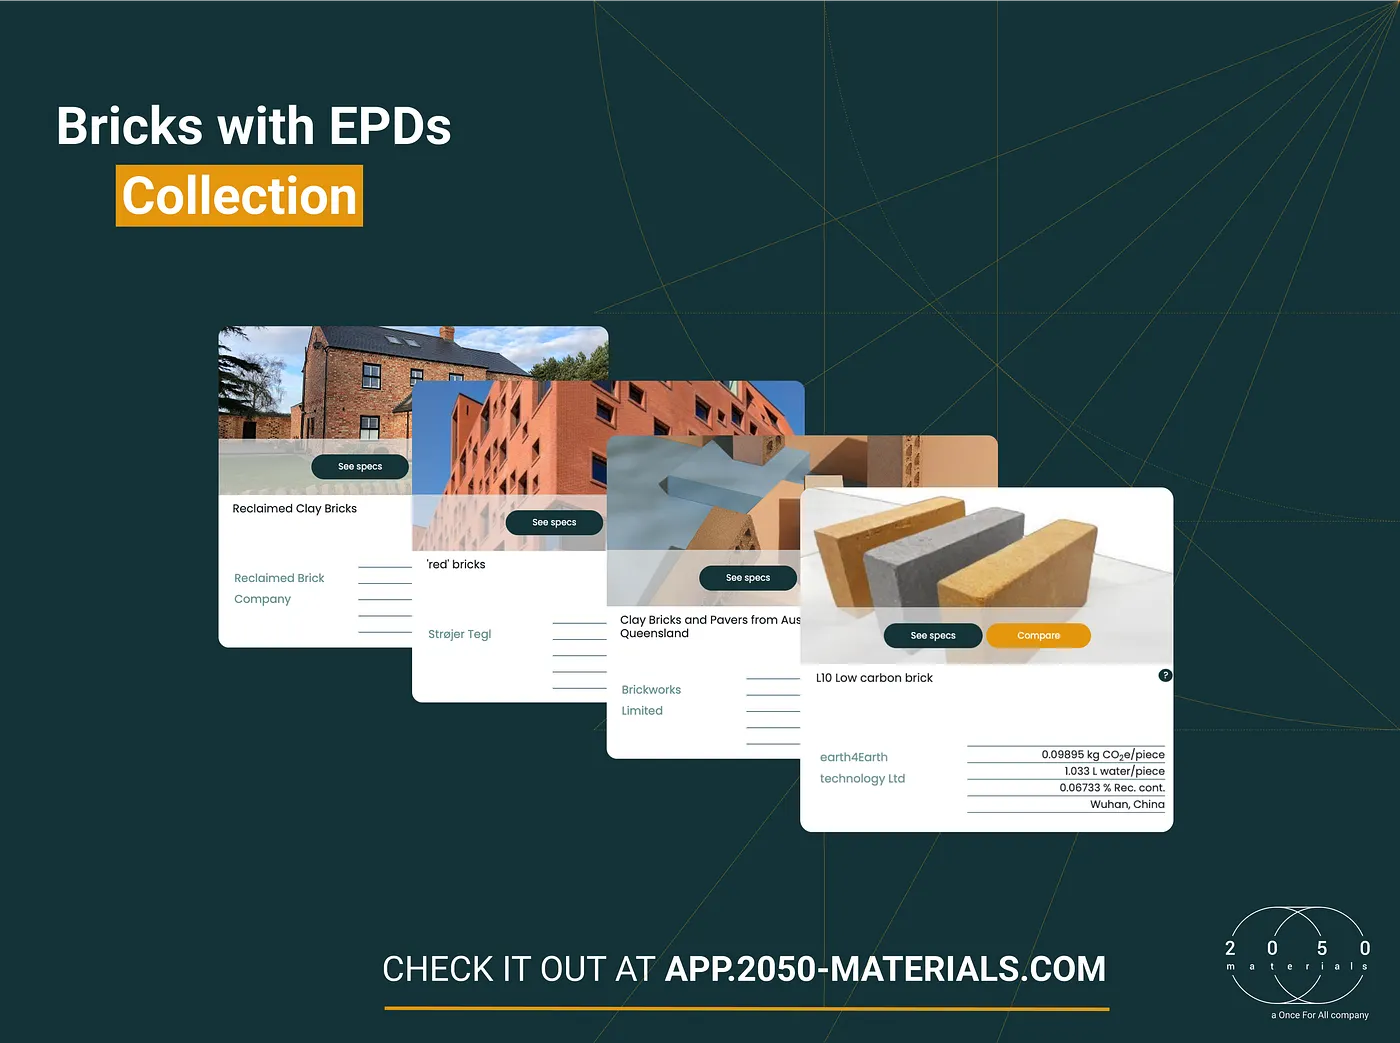
The Most Interesting Brick Products with EPDs on the 2050 Materials Platform
This collection brings together a range of bricks with EPDs listed on the 2050 Materials Platform. They include earth-based bricks, handcrafted bricks, clay bricks, reclaimed bricks, reused clinker bricks, and other specialty brick products.
Read more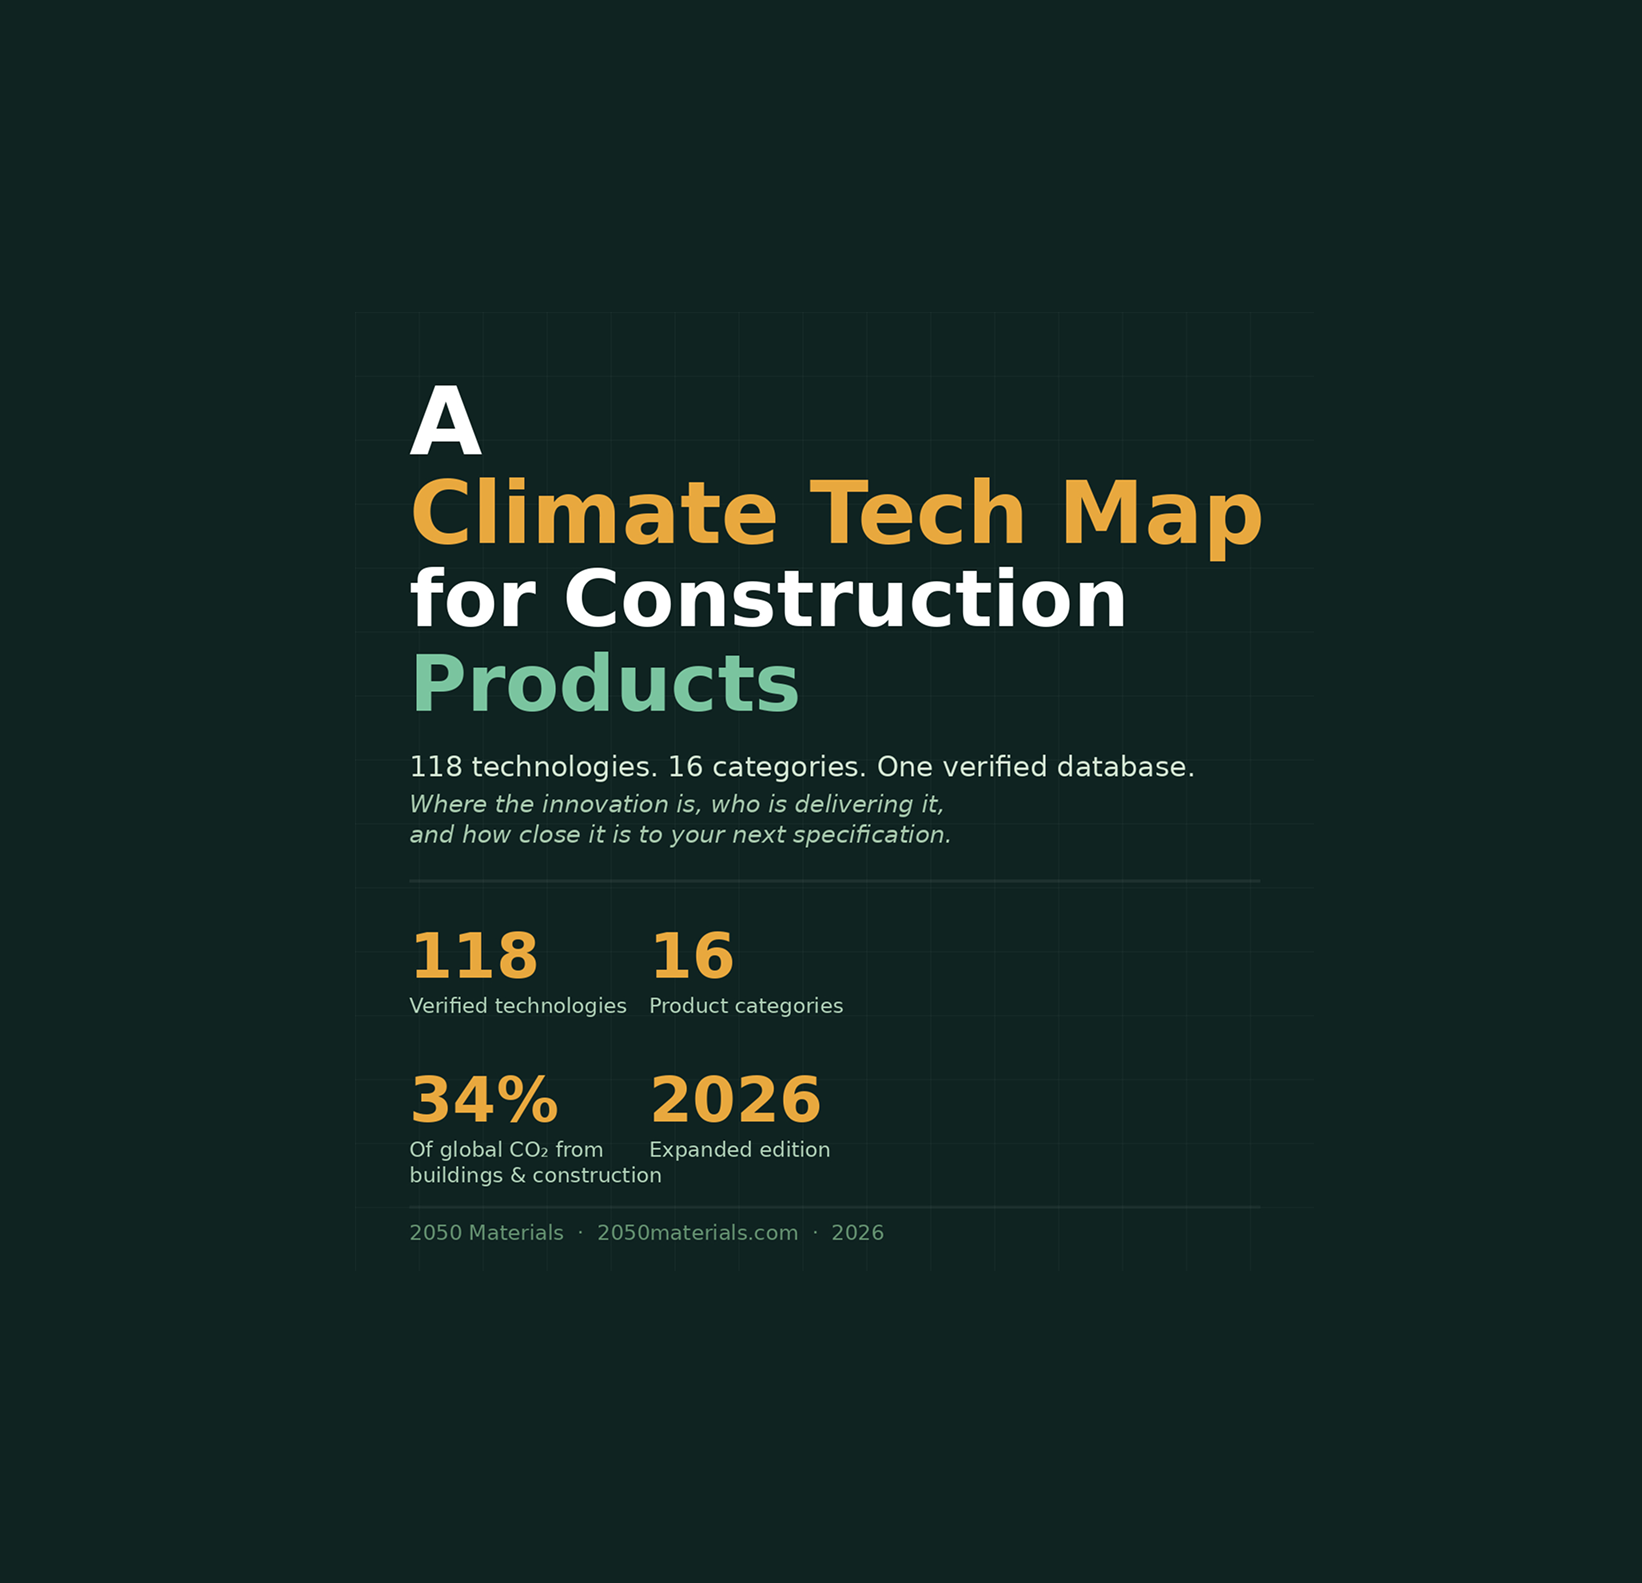
A Climate Tech Map for Construction Products
118 technologies · 16 categories · One verified database. Where the innovation is, who is delivering it, and how close it is to your next specification.
Read more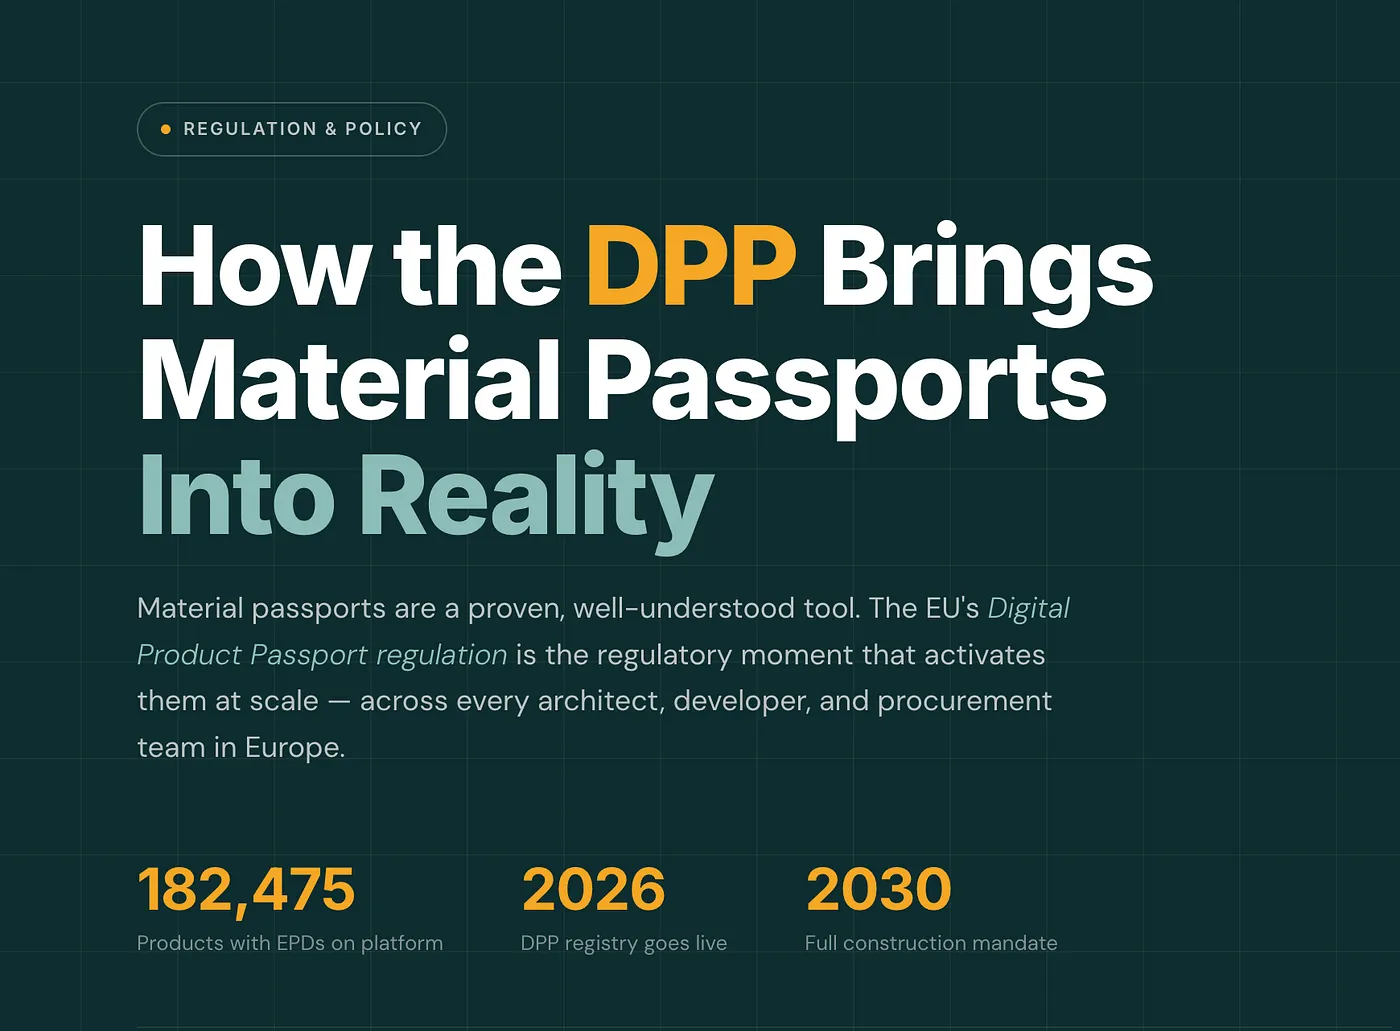
How the Digital Product Passports Bring (Building) Material Passports Into Reality
The EU's Digital Product Passport regulation provides all three simultaneously. A legal mandate across 27 member states. Standardised, machine-readable data requirements defined in law. And a market consequence with real teeth: no compliant passport, no EU market access. The tool hasn't changed. The conditions around it have.
Read more