
The Cost per Tonne Test for Embodied Carbon Swaps
You can count carbon perfectly and still pick the wrong cut
Some carbon reductions are cheap enough that skipping them is indefensible. Others cost a fortune for the tonne they save and get approved anyway because nobody ran the numbers. This companion piece shows why that happens, tests three common swaps against a simple cost per tonne benchmark, and gives you a five minute check plus a calculator for your own project.
In one line: almost nobody checks whether the carbon a reduction removes is actually worth what it costs to remove it. That is the gap this page tests, starting with a calculator you can run on your own numbers, then three common swaps and the checks behind them.
Three swaps. One test.
Same kind of carbon reduction, wildly different cost per tonne removed. Ranked below, then yours.
Why this keeps happening
Someone checks whether Product A beats Product B on kg CO2e. Someone else checks whether Product A beats Product B on price. Nobody checks whether the carbon Product A removes, divided by what it costs to remove it, beats the next swap on the list.
The RIBA 2030 Climate Challenge gives a project an embodied carbon target to hit. Nothing in that process asks whether the money spent chasing it, swap by swap, was well spent. Two reductions can look identical on a carbon report and be worth entirely different amounts of scrutiny.
It is the construction equivalent of judging two diets purely on calories and never once asking what either one costs you in willpower. Both numbers matter. Only one of them usually makes it into the meeting.
The test: cost per tonne
Not producing a carbon number, but knowing whether paying for it was worth it. It borrows its benchmark from a Trellis framework built on Goldman Sachs figures, of all places, an outfit not usually consulted for moral clarity.
Under roughly £75 / tonne
No real argument against it
Ask why it isn’t already specified if it’s not on the job yet.
£75 to £150 / tonne
A genuine premium
Worth the value engineering conversation it usually gets.
Above roughly £150 / tonne
Fine, but needs a reason
A planning condition, a client commitment, a deliberate pilot, not just good intentions.
* Bands adapted from Hunter and Collick’s cost per tonne tiers in Trellis (under $100, $100 to $200, above $300), which cite a Goldman Sachs estimate that about 75% of global emissions are abatable below $200 a tonne. Converted at about $1.33 to the pound (September 2026). Rates move, so treat the edges as a rule of thumb. Our £150 upper band is more cautious than the source’s $300 (about £225).
Run your own swap
Enter the cost premium and the carbon saved for a swap you’re weighing up, and see which band it actually falls into.
* Scale capped at £300 per tonne. Band edges use September 2026 exchange rates, so treat results near an edge as borderline. A quick sense check, not a substitute for full analysis against your cost plan and product level EPD data.
Three swaps, ranked
The three swaps below, run through the cost per tonne test. Swap 1 uses the sourced Harwell EPAC figures; Swaps 2 and 3 are illustrative figures only, not measured results. Replace them with your own product data.
| Swap | £ / tonne CO2e | Band |
|---|---|---|
| | ||
Counting the reduction is the trickier half
Every band above assumes the tonne of CO2e on each side of the comparison is the same tonne. That assumption is where most cost per tonne exercises quietly go wrong.
The Construction Products Association’s review of EPD comparability put a name to this problem: two declarations can both be correctly produced and still not be comparable to each other. Nothing on the front page of an EPD flags that for you, so four checks have to happen before a cost per tonne figure is trusted. It is the least exciting paragraph on this page, and also the one most likely to save you from an argument you cannot win.
Declared unit vs specified quantity
A figure per kilogram of cement is not the same as a figure per cubic metre of ready mix concrete. Compare enough product to do the same job, not the same amount of product.
Matching life cycle stages
One EPD covering A1 to A3 only and another including A4 transport and A5 installation will show a gap that has nothing to do with the product. Compare the same modules on both sides.
Same standard, same database
EN 15804+A1 and the newer +A2 use different characterization factors. ISO 21930, common in North America, runs on TRACI rather than the European method. Background databases such as ecoinvent and GaBi can shift results too. At that point you are not comparing two apples. You are comparing an apple to something that is technically also a fruit.
Consistent biogenic carbon treatment
How biogenic carbon is counted across the modules can flatter or understate a timber option depending on the accounting choice. Both sides of a comparison need the same treatment.
None of this means the EPD system does not work. It means a kg CO2e figure is a starting point, treated as a range with a margin of error, not an exact number to three significant figures. Tighter alignment is coming through EN 15941, the data quality standard published in 2024, but EPDs will take time to catch up to it. Until they do, working from data that has already been standardized and verified does more of that work for you than reconciling mismatched EPDs by hand.
That is the specific problem 2050 Materials’ database of environmental product declarations is built to solve, by holding products to a consistent methodology before a comparison ever reaches a cost report.
Cement replacement quietly reduced
This one is easy to miss because nothing on the drawings changes. The concrete grade stays the same, the structural design doesn’t move, but the GGBS content in the mix can creep down from what was modelled early in design back toward standard Portland cement.
In a 2020 case study, the Southern Construction Framework recorded a 48% cut in the embodied carbon of the structural concrete on its Harwell EPAC project (7,500 m³, from about 2,867 to 1,495 tCO2e) using a 75% GGBS mix in place of 100% Portland cement. The mix carried a premium of about £25,000, roughly £18 per tonne of carbon removed. After netting off an assumed £11,000 carbon offset credit, the net cost was about £14,000 on a £31m project, roughly £10 per tonne.
100% Portland cement baseline
100
index, concrete embodied carbon
75% GGBS mix
52
index, concrete embodied carbon
Source: Southern Construction Framework, 48 Percent Carbon Reduction Using 75 Percent GGBS in Structural Concrete (Harwell EPAC case study).
It is the rare value engineering conversation that argues for itself. Enjoy it. They do not come along often.
Getting a reliable answer starts with a product level EPD rather than a category average, which is exactly the kind of lookup 2050 Materials’ platform is built to make quick instead of a research project in itself.
Timber frame traded for steel or concrete
Or the reverse: mass timber never seriously priced against the frame it could replace. Mass timber schemes look good on the carbon budget and the planning application at concept stage, and the moment a taller core, a longer span, or a fire strategy question shows up, the frame quietly reverts to steel or concrete, carbon consequence unpriced. Which is a polite way of saying nobody wanted to be the one to write “we swapped the timber for concrete” into the sustainability statement.
Run the comparison the other direction and the same gap applies. The embodied carbon case for mass timber is well evidenced, but it typically arrives with a cost premium, a fire strategy and acoustics conversation, and a residual value question at end of life. That puts it in the middle or top band of the test, not the bottom, and skipping the analysis because timber is assumed to be the sustainable choice misses exactly what the test is for.
Whichever direction the swap runs, a fair comparison needs a carbon figure and a cost figure sitting side by side on the same basis, which is easier when both numbers already live in one place, such as 2050 Materials’ platform, rather than two spreadsheets that rarely get compared directly.
Facade or brick buildup, value engineered on looks alone
Facades are visible, expensive, and full of components that all look interchangeable on a cost plan. A recycled content brick or block gets swapped for a cheaper standard equivalent, the elevation looks the same in the render, and the carbon difference, sometimes substantial, sometimes marginal, never gets priced against what else that budget could have done. A render has never once lost an argument on carbon grounds. That is exactly the problem with letting it settle one.
This is precisely the kind of comparison the Embodied Carbon Optimiser on 2050 Materials is built to make instant, swapping components and seeing the carbon consequence right away rather than reconstructing it after the fact.
The five minute check
Tick each box as you actually would in a value engineering meeting. Watch what happens to the answer.
- The reduction’s cost per tonne of CO2e removed has been calculated from an actual product EPD, not a category average
- That figure has been placed in one of the three bands, and the scrutiny it’s getting matches the band
- Someone has checked whether a cheaper tonne is still unclaimed elsewhere on the project
- The swap has been checked against the original design stage carbon budget, not only the cost plan
- The comparison is logged somewhere the Stage 6 as built figure can be checked against later
Most value engineering swaps clear one or two of these, usually the easy ones. Clearing one box is a start. It isn’t a sign off. If ticking one box counted as due diligence, everyone on the project would be a chartered surveyor by lunchtime.
Where 2050 Materials earns its keep here
All three swaps share the same gap: a comparable, verified number that never made it into the room before the instruction went out. Nobody enjoys chasing that number down at 4pm on a Friday before a cost report is due, which is a fairly specific scenario this section exists to prevent.
180,000+
EPDs, structured and comparable
Per 2050 Materials’ own platform. For cement and structural swaps, a mix specific or product specific comparison is a lookup, not a research project.
Optimiser
Embodied Carbon Optimiser
For facade and cladding swaps, swap components and see the carbon consequence immediately, not reconstructed after the fact.
CostX
Carbon data inside CostX
2050 Materials’ carbon data is built into RIB CostX, so carbon figures and cost figures sit next to each other in the workflow you already use. Also available through the 2050 Materials data API.
Useful whether you’re a specifier running the comparison or a manufacturer whose product needs to be found in time to make the case for itself.
Related articles
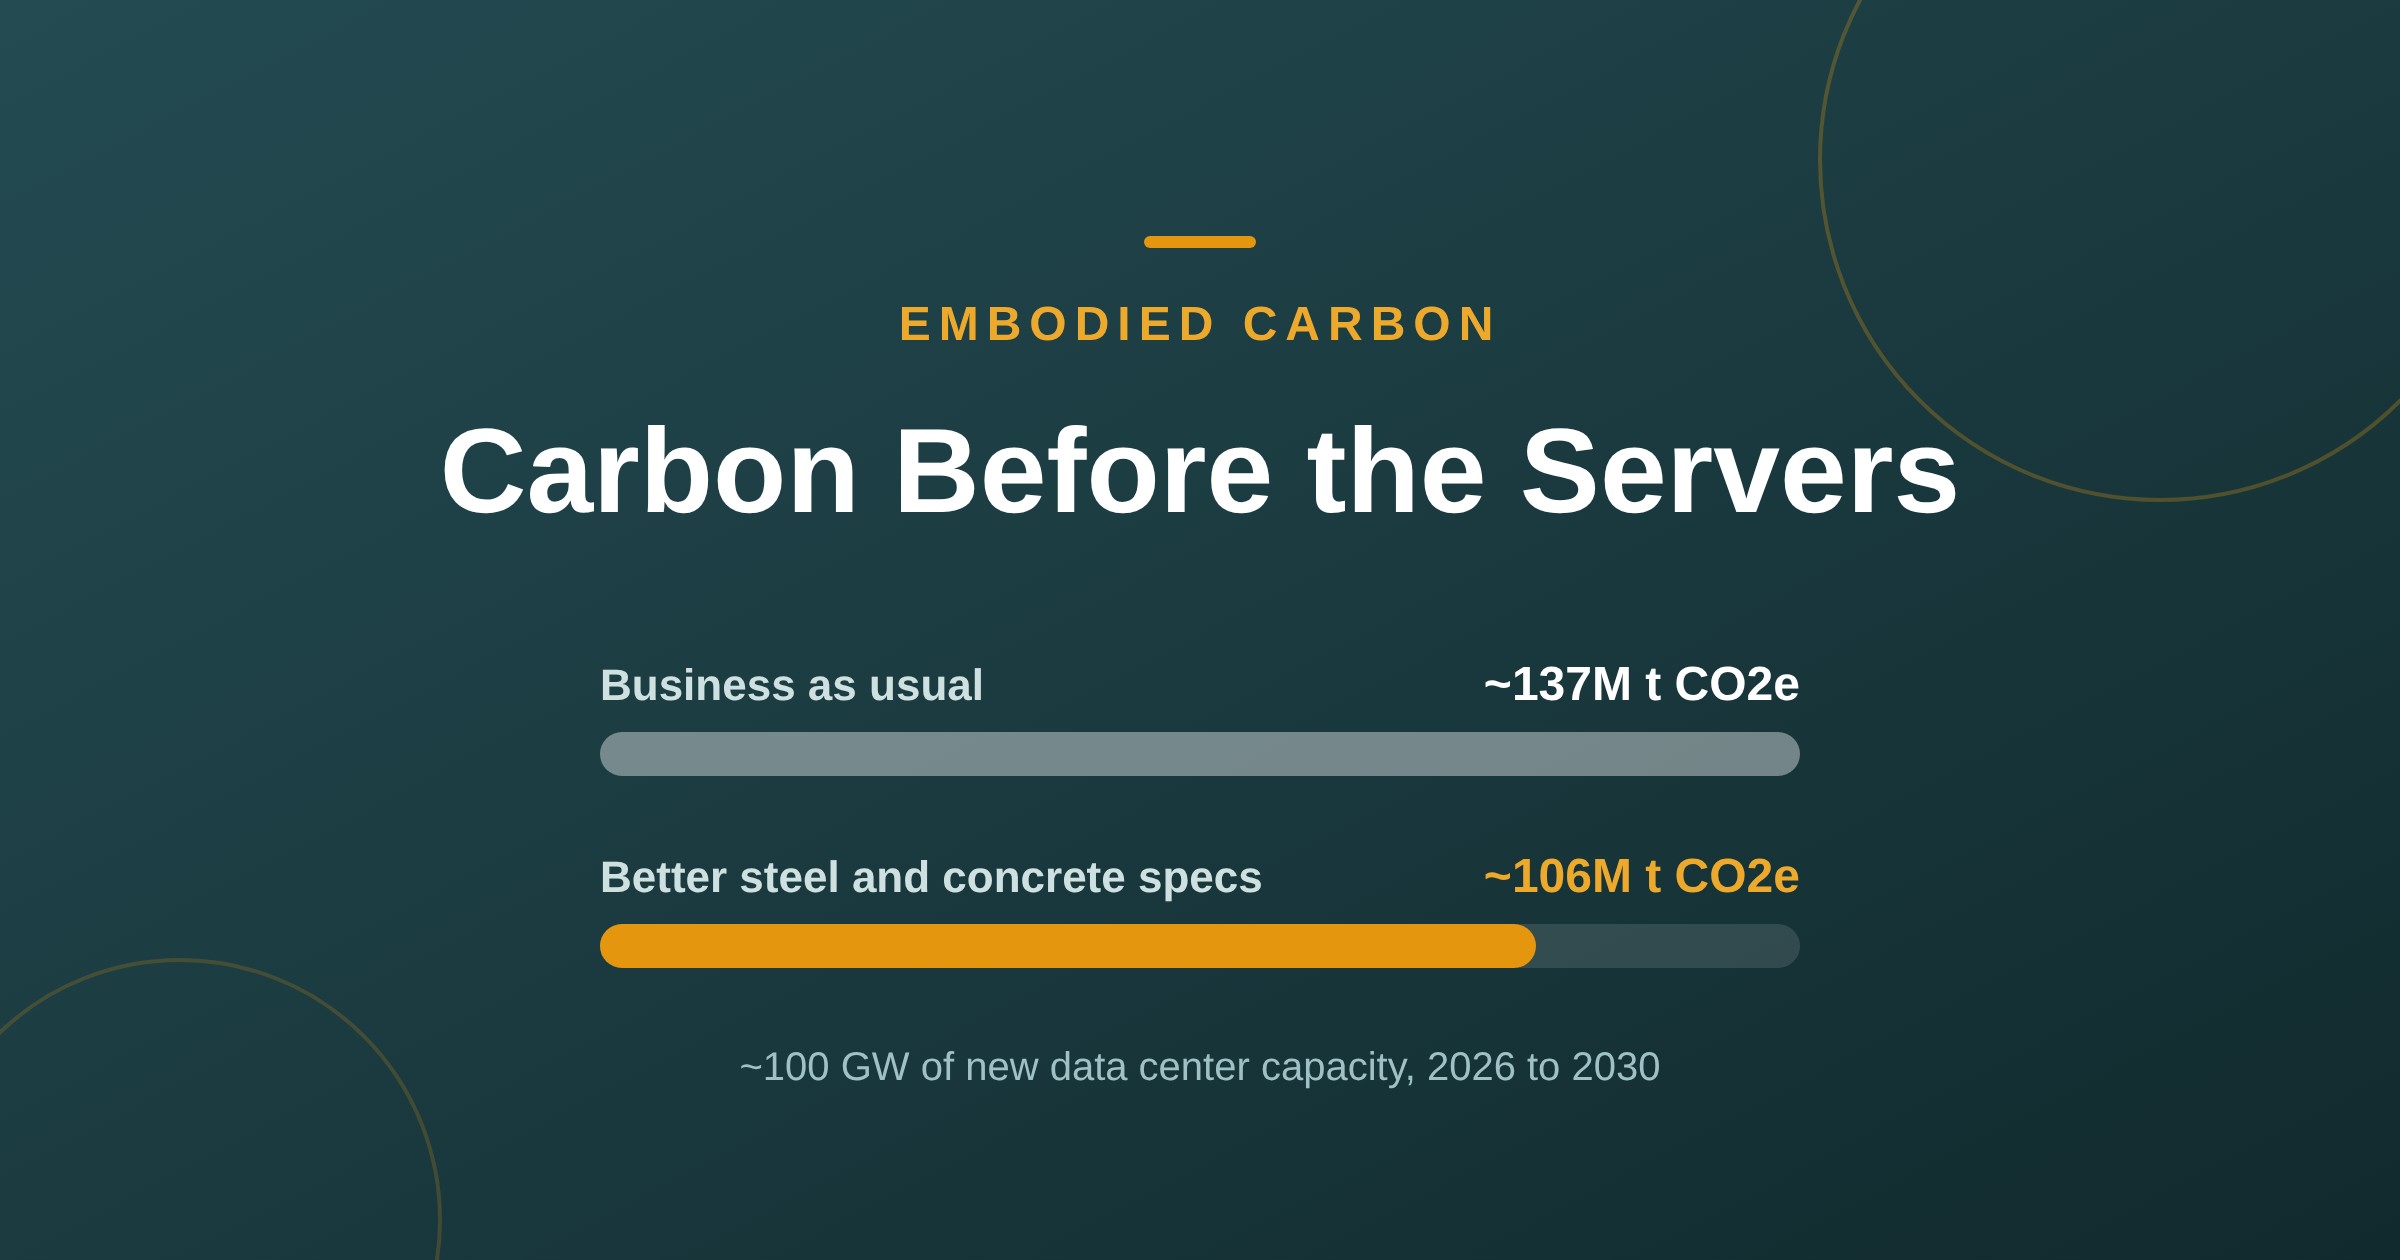
Data Centers’ Hidden 137M-Tonne Carbon Bill
New data centers could lock in ~137M tonnes of CO2e before a single server switches on. GGBS concrete and recycled steel could cut about 31M of it.
Read more
Built to Beat the Heat
This summer's drought wasn't a fluke, it was a preview. Here's the material data that actually decides whether a building shrugs off a heatwave or quietly cooks behind a great winter U value: decrement delay, solar reflectance, SHGC, and the real products behind each one.
Read more
PFAS Compliance Meets Countdown
Sealants, membranes and insulation are next in line for PFAS restrictions. The window to get ahead of it, rather than scramble to catch up, is closing.
Read more