A Climate Tech Map for Construction Products
Construction is responsible for 34% of global CO₂ emissions and consumes 32% of the world’s energy. Those numbers won’t move unless the materials that make up our buildings change. This is the most comprehensive public map of where that change is happening right now, 118 verified technologies across concrete, timber, steel, aluminium, glass, insulation, envelopes, renewables, circularity, and the digital tools that measure it all.
Why Materials Are the Urgent Frontier
For two decades, the construction sector’s decarbonisation conversation was dominated by operational carbon, the energy consumed to heat, cool, and power buildings. Codes tightened, heat pumps scaled, LED lighting became standard. Real progress was made.
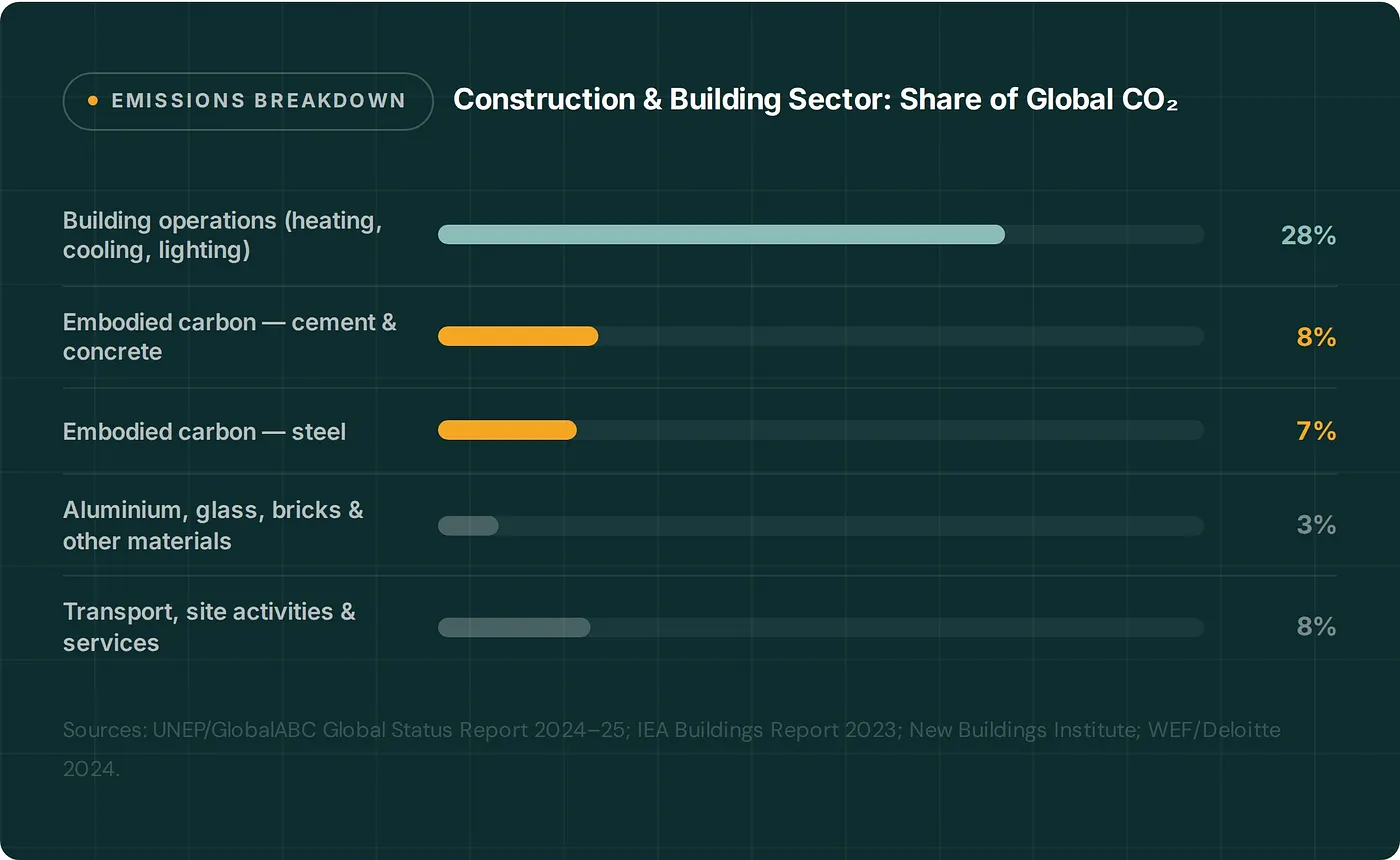
As operational emissions decline, embodied carbon, the CO₂ locked into materials at the point of manufacture is becoming the dominant problem. Cement alone accounts for approximately 8% of global CO₂ emissions annually, producing around 1.56 billion metric tonnes of CO₂ in 2023.¹ Steel contributes a further 7–9%.² Together, cement and steel are responsible for more than half of construction’s total emissions footprint.³
The UNEP and GlobalABC’s 2024–2025 Global Status Report confirms that the sector accounts for 34% of global CO₂ emissions consuming 32% of global energy in the process.⁴ The production and use of cement, steel, and aluminium contribute 18% of those building-related emissions.⁵
 As operational emissions decrease, embodied carbon from materials will account for a larger and larger share of new building emissions and requires urgent policy intervention.
— New Buildings Institute, Embodied Carbon Report, 2025
As operational emissions decrease, embodied carbon from materials will account for a larger and larger share of new building emissions and requires urgent policy intervention.
— New Buildings Institute, Embodied Carbon Report, 2025
The Full Technology Map: 16 Categories, 3 Maturity Stages
The grid below plots all 16 categories across three maturity stages. Commercialised technologies are available on any project today. Scaling technologies can be accessed with additional procurement effort. Emerging technologies represent where the industry will be in three to five years.
How to Read This Map
Commercialised: available through normal supply chains, third-party verified, specifiable today without significant procurement complexity.
Scaling: commercially available at limited scale, higher cost, or select geographies.
Emerging: in pilot, R&D, or early-commercial stage. Significant promise but not yet reliable for most projects.
Climate Technologies in Construction — All 15 Categories by Maturity Stage
View the full database by submitting your contact details
Concrete & Cement: The Hardest Problem, the Most Innovation
With 22 database entries, the largest category by far, concrete and cement represent both the greatest challenge and the most active innovation frontier. Cement accounts for approximately 8% of global anthropogenic CO₂, with more than 50% arising from the chemical decomposition of limestone during clinker calcination not from burning fossil fuels.⁷ Even fully electrifying kilns would leave most emissions intact, requiring fundamentally different chemistry.
Key Insight — Cement Decarbonisation Pathways
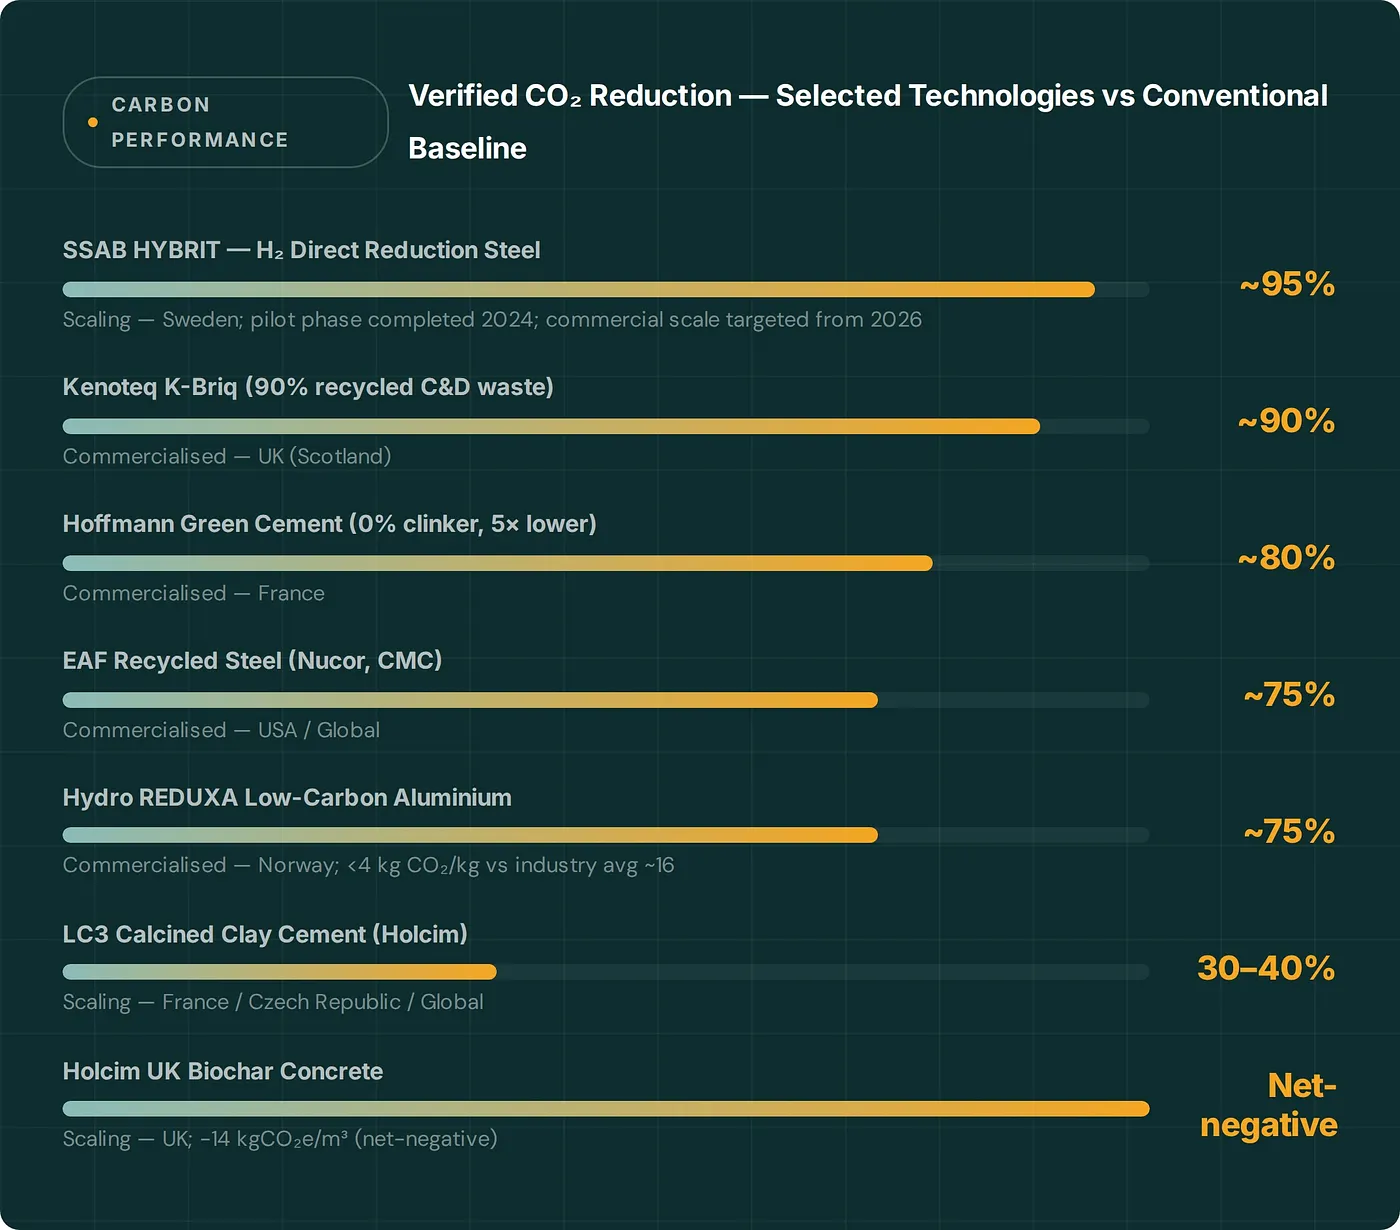
Clinker replacement (LC3, GGBS/Ecocem, geopolymers, Hoffmann Green): 30–100% CO₂ reduction without process redesign — commercially available today.
Alternative chemistries (Brimstone, Solidia, Sublime Systems): new binders that eliminate the calcination step or cure with CO₂ rather than water — approaching commercialisation.
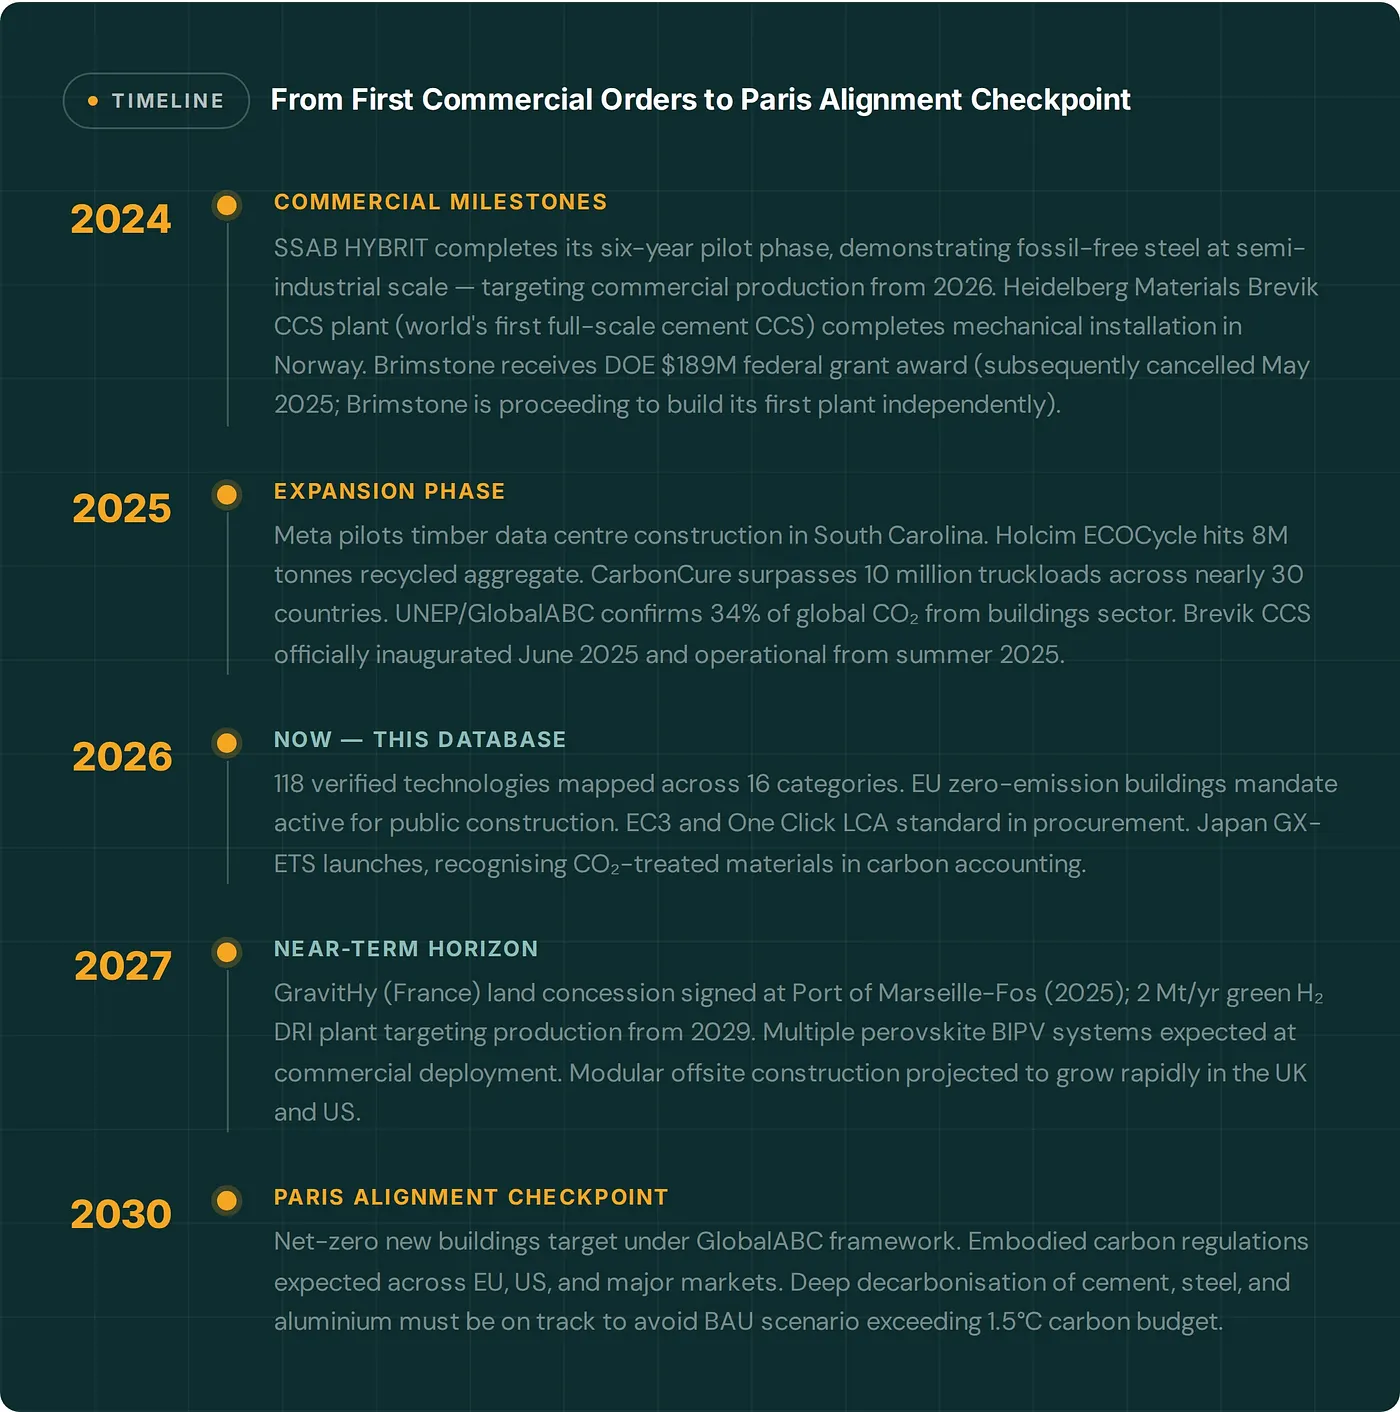
CCS integration: Heidelberg Materials Brevik is the world’s first full-scale cement CCS plant, inaugurated June 2025 and operational from summer 2025.
Bio-enhanced net-negative (Holcim UK biochar concrete, Kajima CO₂-SUICOM): products verified to sequester more carbon than they emit.
Carbon Capture in the Material Itself
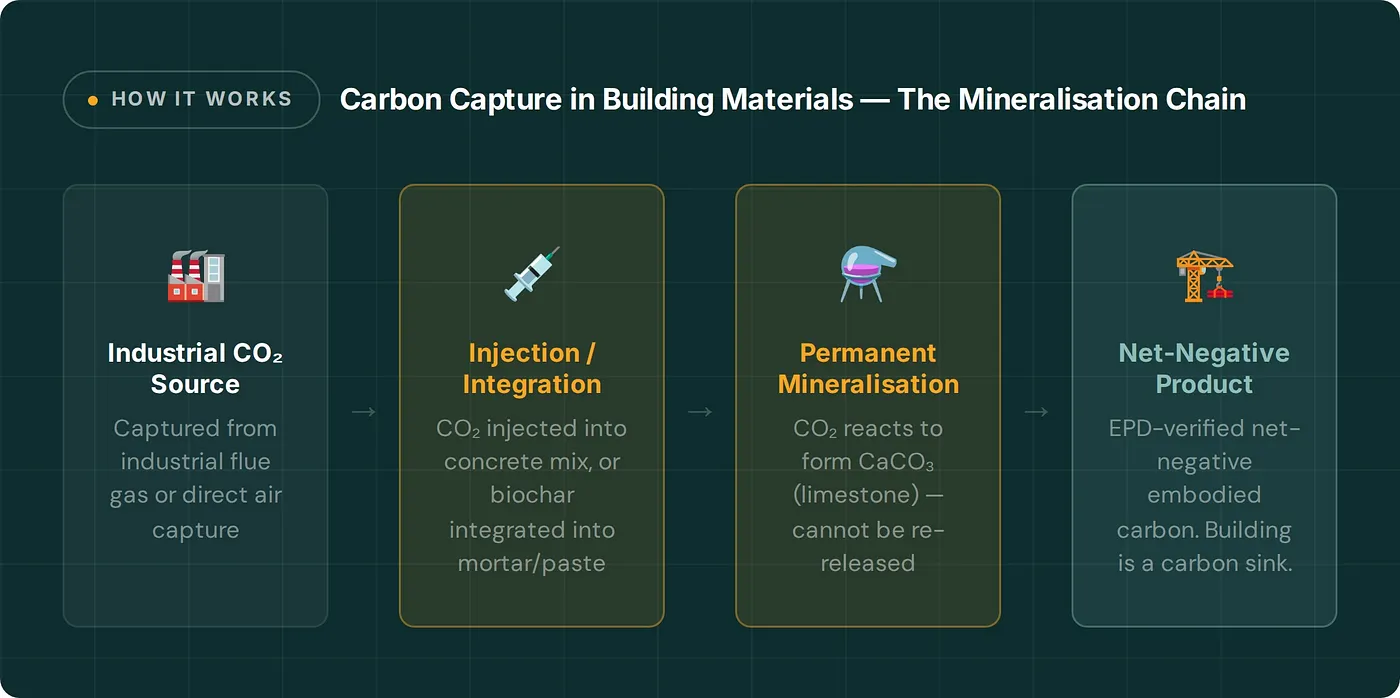
Materials that don’t merely reduce carbon but actively capture and permanently store it represent the most counterintuitive frontier in construction. This isn’t carbon offsetting, it is carbon mineralisation embedded directly into the product. The building material becomes a carbon sink.
CarbonCure’s process exemplifies the principle at commercial scale. CO₂ is injected into ready-mix concrete during production, reacting permanently into calcium carbonate minerals. As of 2025, CarbonCure’s technology has been applied to over 10 million truckloads of concrete across nearly 30 countries.
Bio-Based Insulation: A Category Deep-Dive
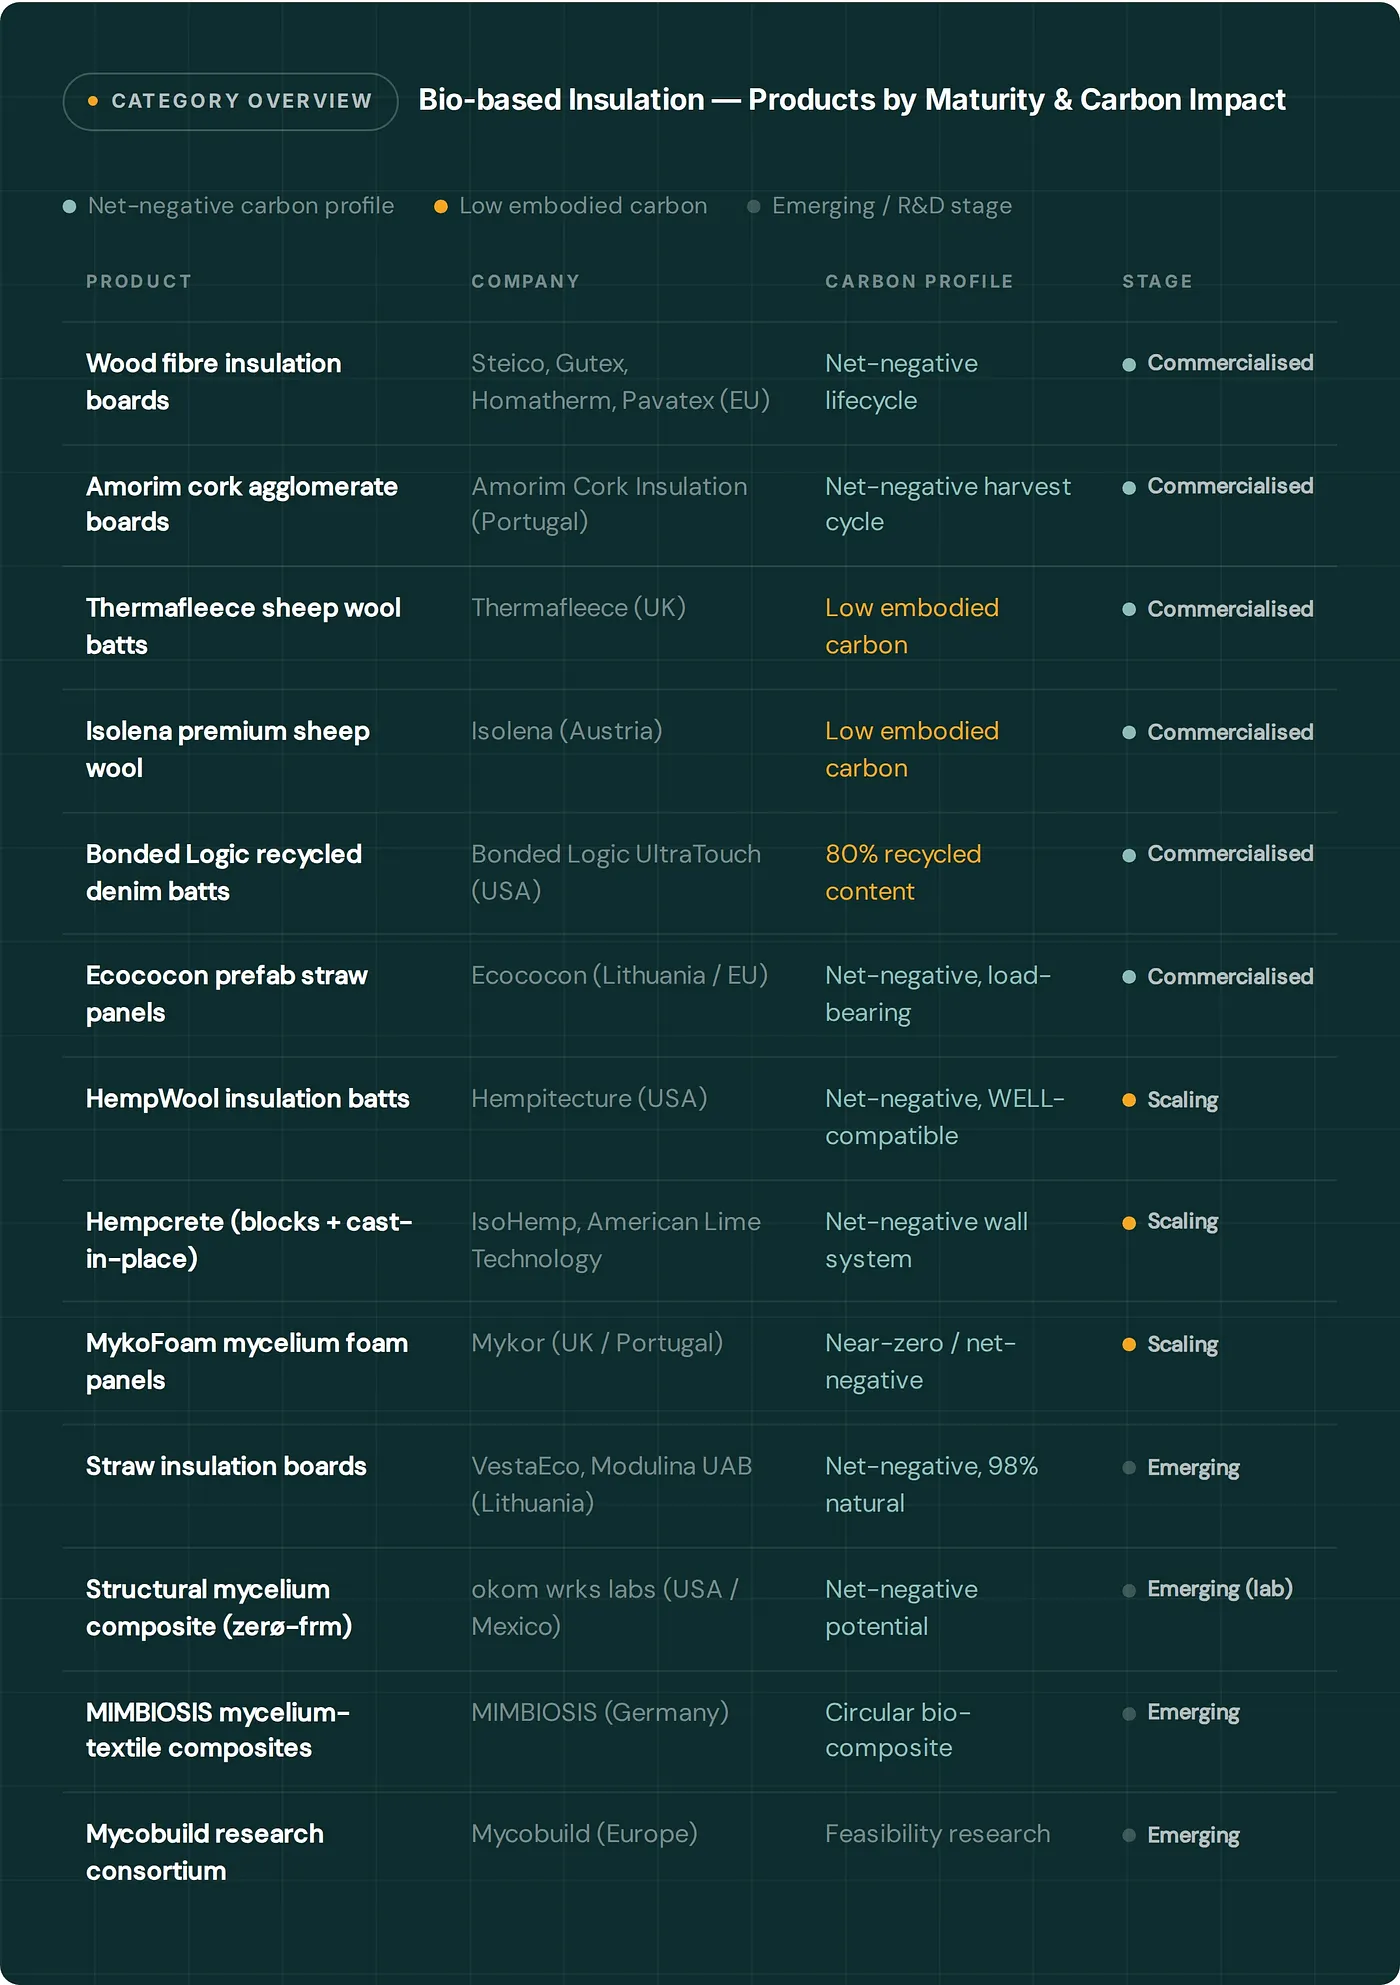
With 13 entries, bio-based insulation is the second-largest category and the one with the most commercially available net-negative options. Wood fibre boards (Steico, Gutex, Homatherm, Pavatex) are mainstream across the EU. The expanded 2026 database adds cork (Amorim), sheep wool (Thermafleece, Isolena), recycled denim (Bonded Logic 80% recycled content), and mycelium innovations (Mykor, okom wrks labs, MIMBIOSIS).
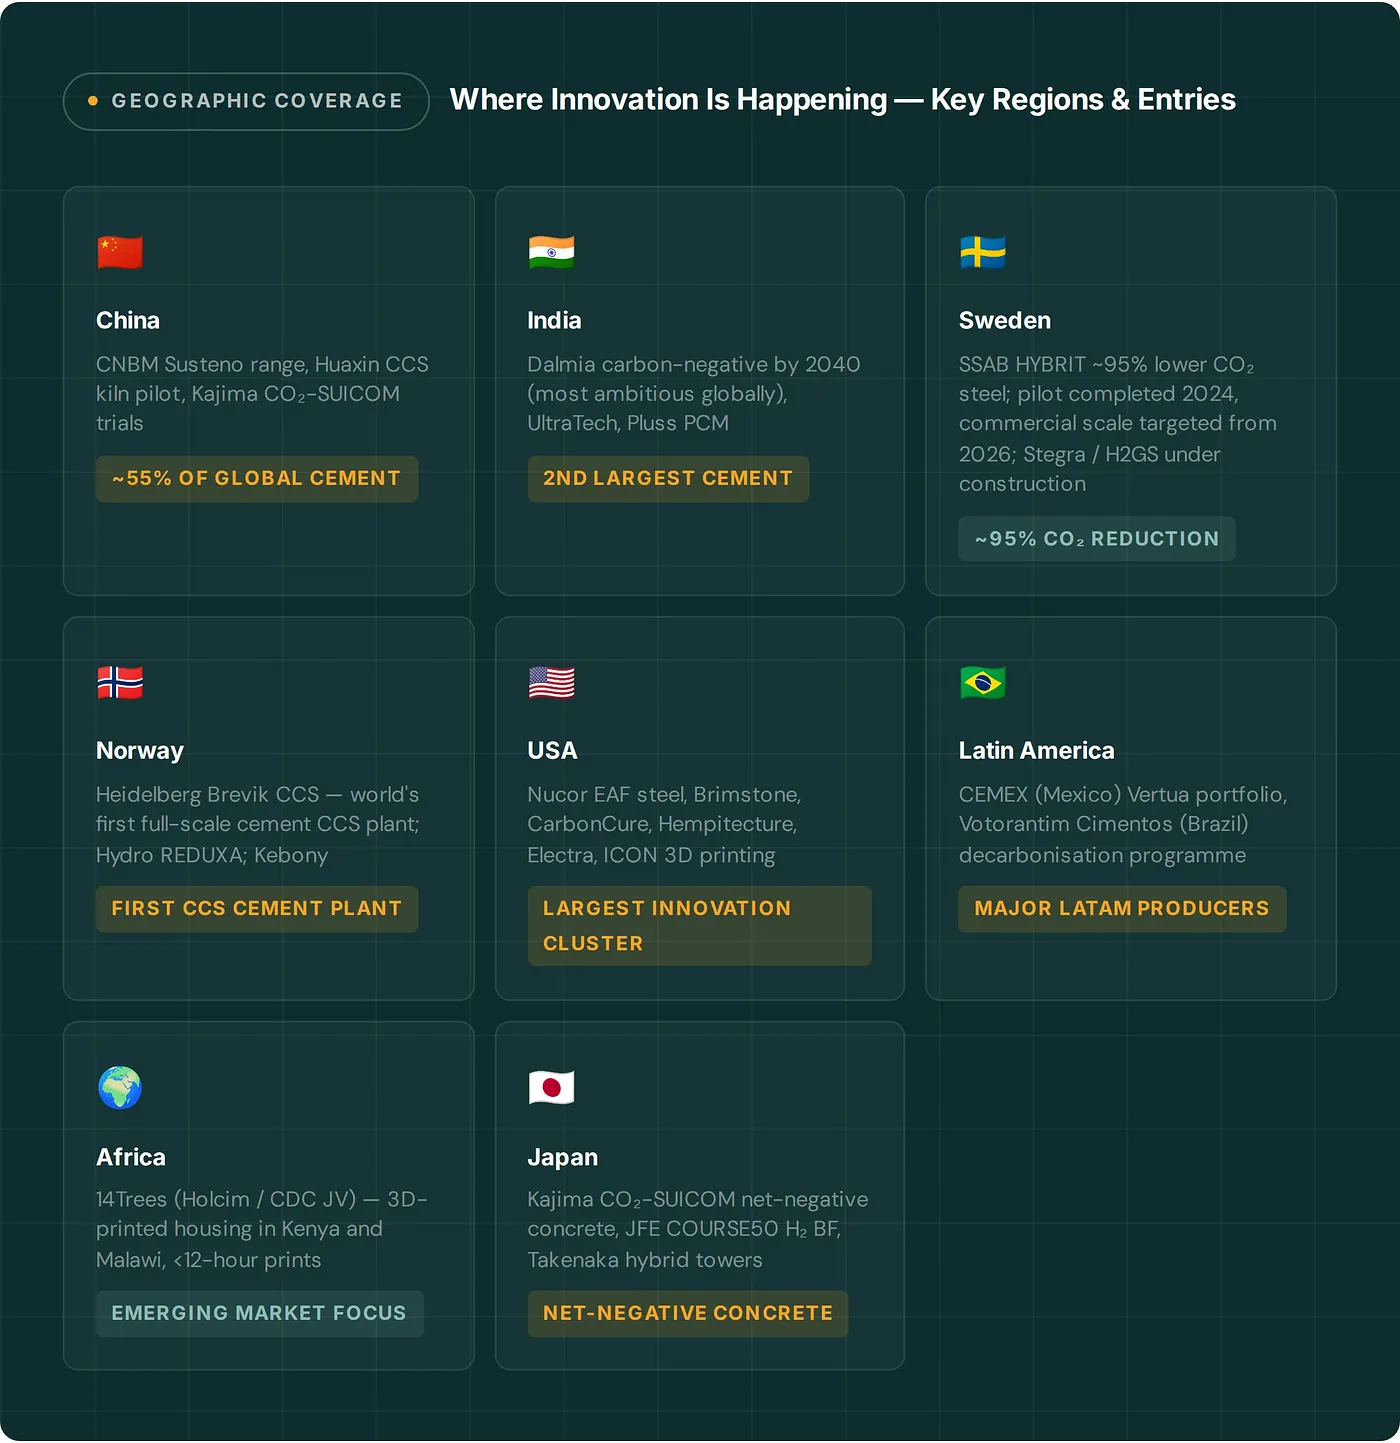
A Genuinely Global Picture
The innovation narrative was dominated by the US, EU, and Nordic countries, obscuring a critical truth: the countries responsible for the largest share of construction emissions are in Asia, Latin America, and Africa. China produces approximately 55% of global cement output. This expanded database addresses that gap explicitly.
Five Things This Map Tells Us
01 The carbon-negative frontier is arriving faster than most people realise.
Biochar concrete, hempcrete, mycelium insulation, and CO₂-mineralised ready-mix are all producing materials with net-negative embodied carbon today.
02 Concrete and timber are the highest-leverage categories for specifiers right now.
Both have credible, commercially available pathways to 50%+ reduction. Specifiers not yet asking for CarbonCure concrete or mass timber structures are leaving the single largest opportunity on the table.
03 Eight categories that barely existed in prior maps are now critical.
Low-carbon aluminium, BIPV, bricks & masonry, phase-change materials, cool roofing, modular construction, low-carbon glass, and embodied carbon software are all significant new frontiers mapped here for the first time.
04 The geography matters as much as the technology.
China produces ~55% of global cement; India is the second-largest producer. Any credible map that ignores CNBM, UltraTech, Dalmia, Huaxin, or Votorantim is missing where the emissions actually are.
05 The EPD gap remains the single biggest adoption barrier.
Many promising technologies lack third-party verified Environmental Product Declarations. Without verified data, specifiers cannot use these products in whole-life carbon assessments — which is precisely what 2050 Materials exists to solve.
The Urgency Window
The global building stock is expected to double in floor area by 2050.⁴ Every square metre is a decision about embodied carbon — locking in either the old chemistry or the new. The window to act is this decade.
The construction carbon footprint has doubled over three decades. Business-as-usual projects it to double again by 2050 — exceeding the entire per-annum carbon budget for 1.5°C on its own.
— Communications Earth & Environment, October 2025
Conclusion: The Map Is Not the Territory — But It Is a Start
Every technology in this database exists. The argument that low-carbon construction is not yet possible — too expensive, too early, or too unproven — does not hold against a database of 118 verified entries. A specifier can choose from CLT, glulam, EAF steel, or H₂-DRI steel; from hemp, cork, wood fibre, or sheep wool; from LC3, geopolymers, CO₂-cured products, CarbonCure, and more.
The challenge is no longer whether these materials exist. It is whether the industry creates the specification culture, procurement expectations, and regulatory framework that makes choosing them the norm rather than the exception.
But there is a structural barrier that sits upstream of all of it: data. A specifier cannot choose a lower-carbon concrete if they cannot compare its verified carbon footprint against the conventional alternative in a format that holds up to regulatory scrutiny. A developer cannot demonstrate embodied carbon compliance without Environmental Product Declarations that are independently verified, current, and product-specific. A procurement team cannot write a low-carbon material requirement if the data to enforce it doesn’t exist.
This is where the map meets the market. Every technology category in this database — from biochar concrete to hydrogen-reduced steel to mycelium insulation — has a corresponding EPD data layer on the 2050 Materials platform. Over 182,000 construction products, verified against international standards, searchable by material type, carbon performance, geography, and application. The platform is the connective tissue between what this map shows is possible and what specifiers can actually put in a project.
The 118 technologies mapped here are the supply side. 2050 Materials is where the demand side connects with the verified product-level data to act on it — at the point of specification, on any project, today.
Explore the full database at 2050-materials.com
Sources & References
1. Global Carbon Project. Carbon dioxide emissions from cement worldwide, 1960–2023. Statista, November 2024. https://www.statista.com/statistics/1299532/carbon-dioxide-emissions-worldwide-cement-manufacturing/
2. World Economic Forum. 4 ways to make the cement industry more sustainable. September 2024. https://www.weforum.org/stories/2024/09/cement-production-sustainable-concrete-co2-emissions/
3. Communications Earth & Environment. Carbon footprint of the construction sector projected to double by 2050 globally. October 2025. https://www.nature.com/articles/s43247-025-02840-x
4. UNEP / GlobalABC. Global Status Report for Buildings and Construction 2024–2025. 2025. https://www.unep.org/resources/report/global-status-report-buildings-and-construction-20242025
5. UNEP. Building Materials and the Climate: Constructing a New Future. 2023. https://www.unep.org/resources/report/building-materials-and-climate-constructing-new-future
6. IEA. Buildings — Energy Technology Perspectives 2023. https://www.iea.org/energy-system/buildings
7. ESSD. Global and national CO₂ uptake by cement carbonation from 1928 to 2024. Niu et al., May 2025. https://essd.copernicus.org/articles/17/2231/2025/
8. Van Roijen, E. et al. Building materials could store more than 16 billion tonnes of CO₂ annually. Science 387, 2025.
9. Lan, K. et al. Global land and carbon consequences of mass timber products. Nature Communications 16, 4864, 2025. https://www.nature.com/articles/s41467-025-04864-x
10. SSAB. HYBRIT — Fossil-free steel. 2024. https://www.ssab.com/en/fossil-free-steel
11. New Buildings Institute. Embodied Carbon. Policy resource, 2025. https://newbuildings.org/code_policy/embodied-carbon/
12. Nature Communications. Projecting future carbon emissions from cement in developing countries. Cheng et al., December 2023. https://www.nature.com/articles/s41467-023-43660-x
13. World Economic Forum. Why the building sector’s emissions milestone demands data-driven reinforcement. May 2025. https://www.weforum.org/stories/2025/05/building-construction-emissions-data/
14. CarbonCure Technologies. CarbonCure producers reach 10 million truckloads milestone. November 2025. https://www.carboncure.com/news/carboncure-producers-reach-milestone-of-10-million-truckloads/
Related articles
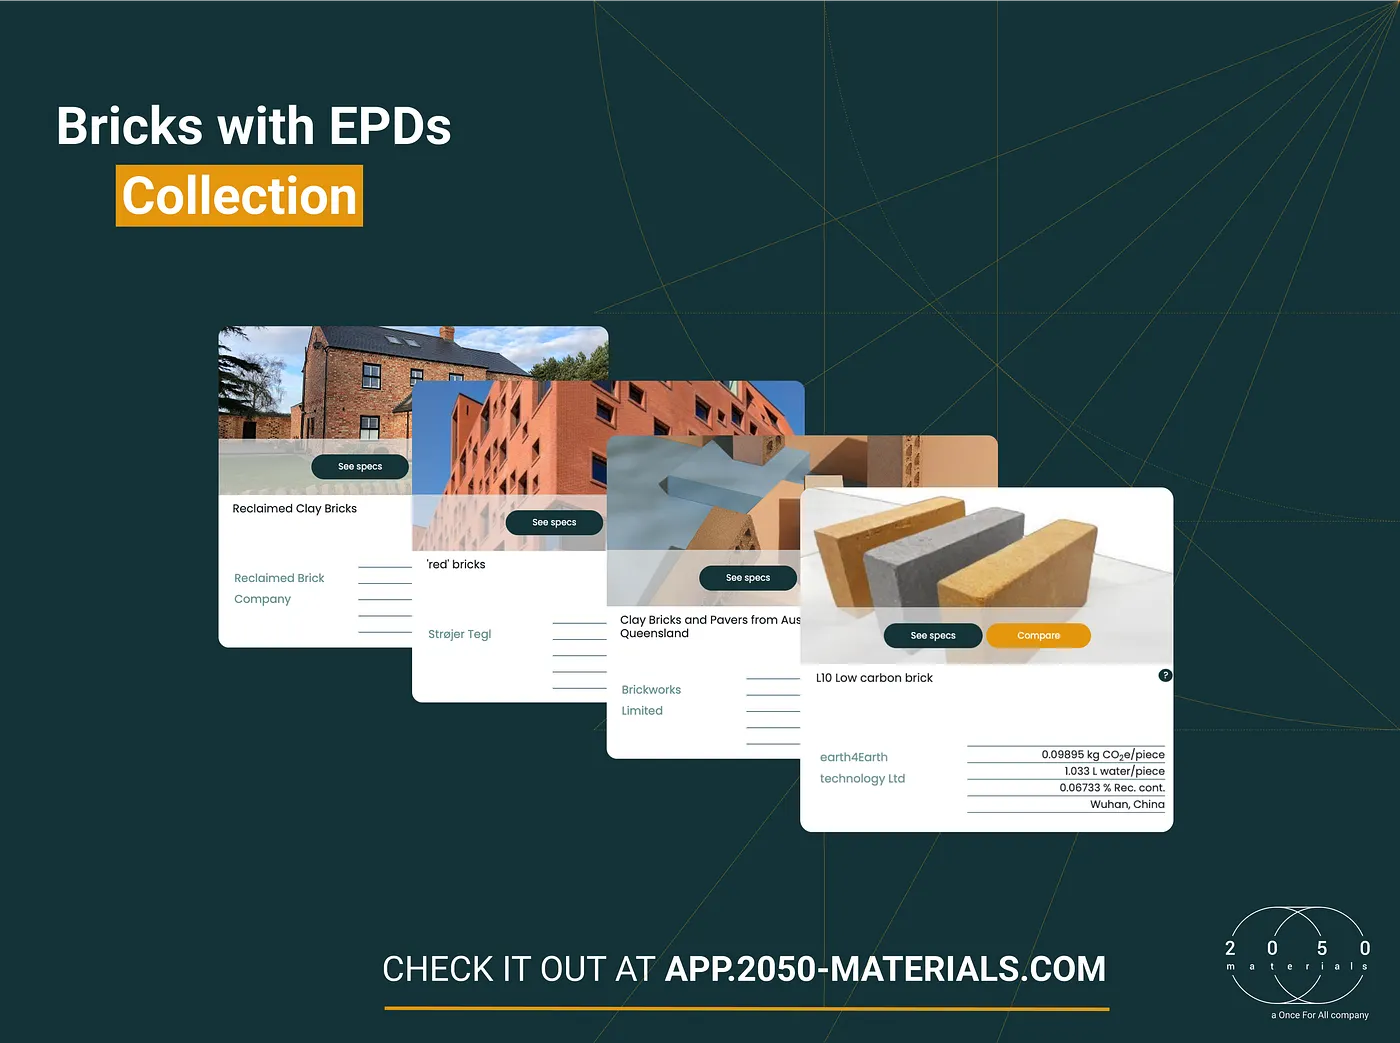
The Most Interesting Brick Products with EPDs on the 2050 Materials Platform
This collection brings together a range of bricks with EPDs listed on the 2050 Materials Platform. They include earth-based bricks, handcrafted bricks, clay bricks, reclaimed bricks, reused clinker bricks, and other specialty brick products.
Read more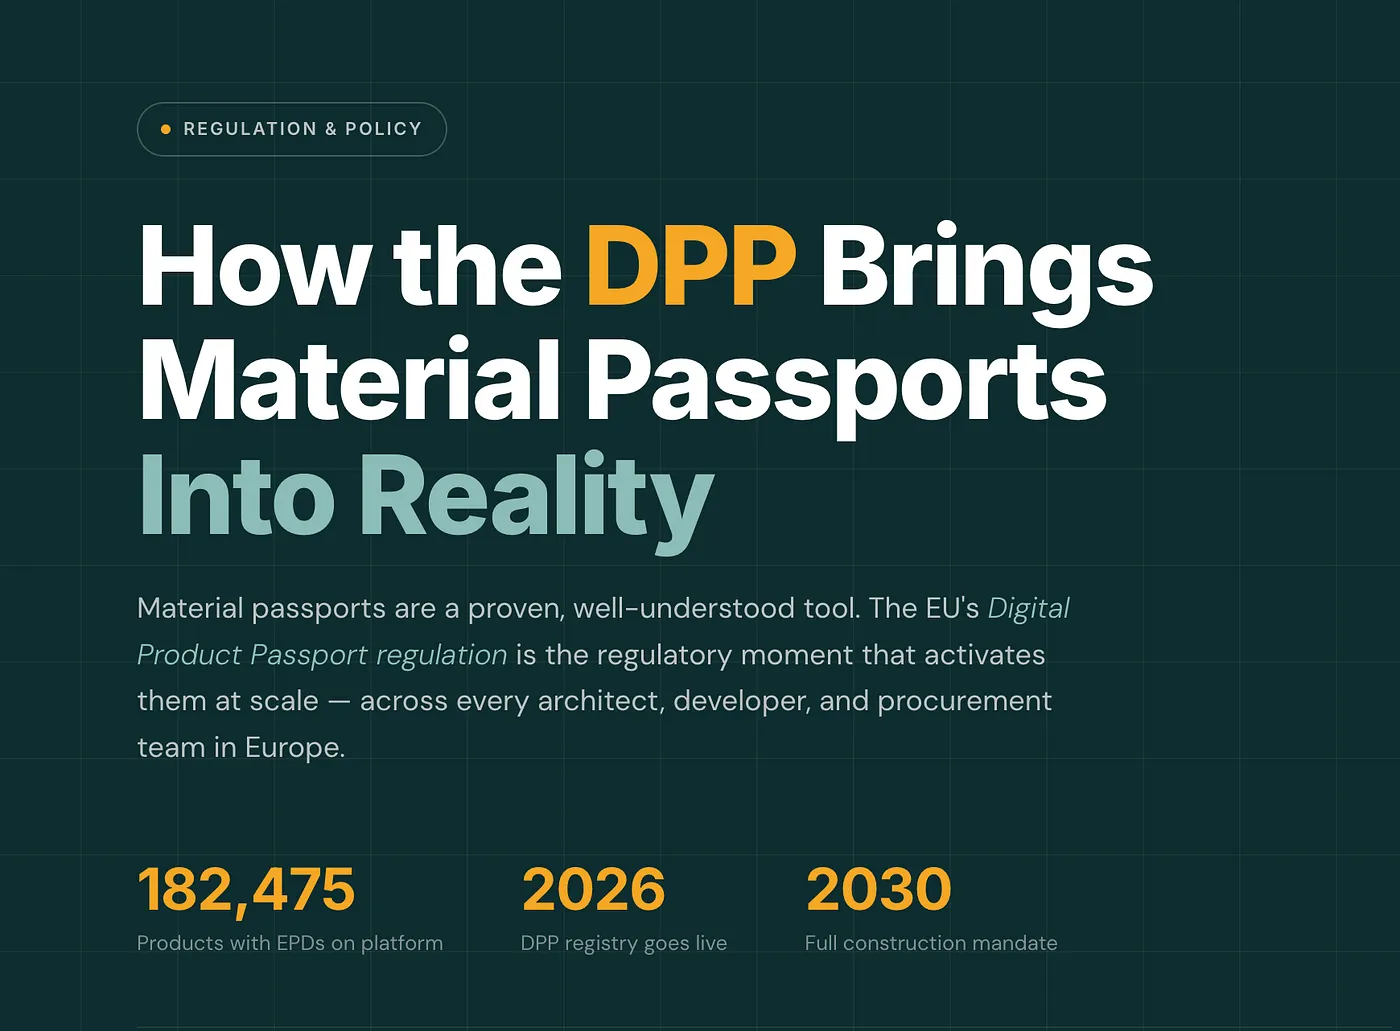
How the Digital Product Passports Bring (Building) Material Passports Into Reality
The EU's Digital Product Passport regulation provides all three simultaneously. A legal mandate across 27 member states. Standardised, machine-readable data requirements defined in law. And a market consequence with real teeth: no compliant passport, no EU market access. The tool hasn't changed. The conditions around it have.
Read more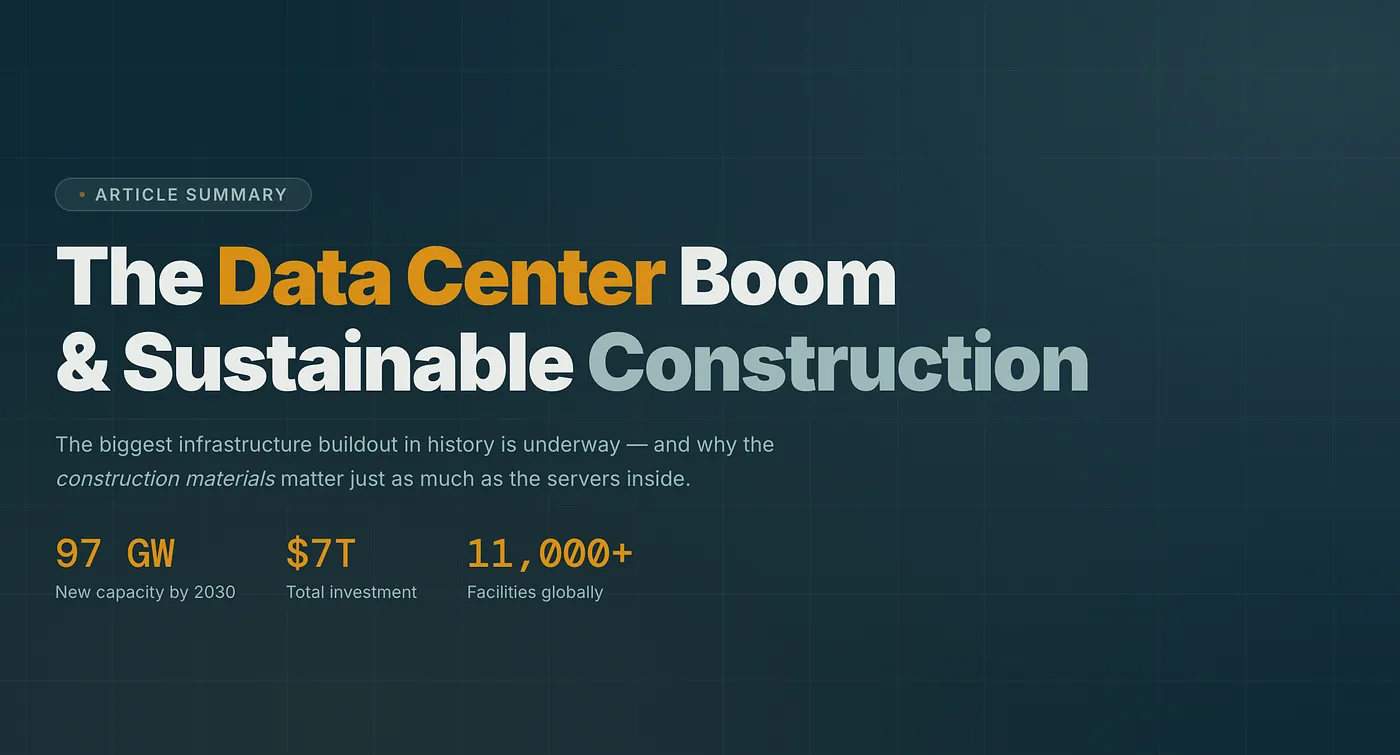
The Data Center Boom: Why Sustainable Construction Must Keep Pace with Digital Demand
The global data center boom is accelerating fast and the construction industry needs to keep up sustainably. As companies invest nearly $7 trillion in digital infrastructure through 2030, embodied carbon in concrete, steel, and MEP systems is becoming one of the most critical and overlooked levers for emissions reduction. Here's what the numbers say, what industry leaders are doing, and why EPD-verified material data is essential for building responsibly at scale.
Read more