Cost Meets Carbon: 3 Value Engineering Swaps
What if the biggest threat to your carbon target is not a bad decision, but a good one made at the wrong moment? Every project has one of these. Somewhere around RIBA Stage 4, a cost consultant flags a line in red, a substitution gets proposed, and everyone nods because the number goes down. Nobody in that room is trying to sabotage the carbon target. They are trying to hit budget. But by the time the contractor has poured the concrete or hung the cladding, the low carbon promise made back at Stage 2 can have quietly doubled in places, and nobody circled back to check.
We went looking for the substitutions that do the most damage and that actually turn up again and again on real projects, not just the ones with the tidiest carbon data attached. Here are the three that made the cut, with the receipts for both parts of that claim.
Why this keeps happening
Cost plans and carbon plans rarely live in the same spreadsheet. The RIBA Plan of Work treats Stage 4 as the last real opportunity for design change before construction information is frozen, and tender packages are typically issued at the end of that stage. That means the moment when substitutions are cheapest to make is also the moment when nobody in the room is required to check the carbon consequence. The RIBA 2030 Climate Challenge sets embodied carbon targets as early as Stage 0, but there is no equivalent gateway forcing a recheck when the specification changes months later. That gap is not a technicality. It is exactly where these three swaps live.
Swap 1: Timber structure traded for concrete or steel
Timber framed and mass timber schemes are increasingly common at concept stage, and on paper they look great for both the carbon budget and the planning application. Then a structural engineer runs the numbers for a taller core, a longer span, or a fire strategy the insurer is not keen on, and the frame quietly becomes concrete or steel.
The scale of that swing is bigger than most cost consultants expect. Life cycle studies comparing structural options on the same building find that a full timber structure cuts embodied carbon somewhere between 13 and 26 percent compared with a conventional structure, largely because timber avoids the manufacturing emissions of steel and concrete while also storing carbon for the life of the building. Run that the other way, and dropping timber for concrete or steel late in design can add much of that saving straight back onto the number promised to the planning authority or the client’s ESG report. A Monte Carlo uncertainty analysis of mid rise buildings in Australia by Robati and Oldfield (2022) put real numbers on that gap: a mean of 417 kgCO2e per square metre for a mass timber structure against 465 kgCO2e per square metre for its post tensioned concrete equivalent, a difference of 48 kilograms of CO2e per square metre of floor area that adds up fast across a whole building.
Swap 2: Cement replacement dropped from the concrete mix
This one is sneaky. The concrete grade stays the same. The drawings do not move. But somewhere in the batching plant, the mix quietly switches from a blend containing ground granulated blast furnace slag (GGBS) back to standard Portland cement, usually because GGBS availability tightened, lead times slipped, or a supplier could not guarantee the blend in time for the pour.
The gap between the two is not small. According to Heidelberg Materials’ own environmental product declaration, a tonne of its low carbon GGBS blend carries a global warming potential of around 155 kilograms of CO2e, against roughly 804 kilograms of CO2e for a tonne of standard CEM I cement, a difference of around 780 kilograms of CO2e for every tonne of binder swapped back. On a concrete framed building, that one change to the mix design can undo a meaningful chunk of whatever saving the structural engineer built into the Stage 2 model.
One honest caveat worth flagging before this goes any further: GGBS is a byproduct of blast furnace steelmaking, and UK supply has been shrinking as primary steel production declines. Some industry commentators argue that specifying maximum GGBS content on every project simply moves a limited resource away from someone else’s job, rather than reducing carbon at a national level. That does not make dropping it late in your own project any less of a problem for your Stage 2 target, but it does mean the fix is not simply asking for more GGBS everywhere. It is planning the mix design and supply chain early enough that nobody needs to swap it out under time pressure.
Swap 3: The facade or cladding buildup
Facades are where a lot of value engineering conversations end up, because they are visible, expensive, and full of components that all look interchangeable on a cost plan. The American Institute of Architects lists the building envelope alongside MEP systems and lighting as one of the most common starting points for a value engineering exercise, precisely because it represents such a large share of project cost. The trouble is that aluminium and glass, the workhorses of most curtain wall systems, are some of the most carbon intensive materials on the entire building, and a seemingly small change (tighter mullion spacing, a heavier rainscreen, an extra layer in a shadow box buildup) can move the number a lot.
The building envelope is consistently ranked, alongside the structural frame, as one of the two elements carrying the largest share of a building’s embodied carbon, a finding that runs through LETI’s own Embodied Carbon Primer. That is why a change that looks purely cosmetic on a rendering can carry real weight on the carbon plan.
Recent life cycle modelling of curtain wall facades found that shifting from an aluminium intensive design to a higher circularity timber hybrid system reduced facade global warming potential from roughly 380 to 400 kilograms of CO2e per square metre down to around 270 to 300 kilograms of CO2e per square metre. Make Architects’ own sensitivity studies on curtain walling report the same pattern in reverse: tightening mullion centres or adding an extra material layer for weathering or aesthetics can increase embodied carbon significantly, even when the glazing itself does not change. Because facades this late in a project rarely get modelled again after Stage 3, that increase can go completely unnoticed until someone runs a Stage 6 as built assessment and cannot explain the gap.
The five minute check that stops all three
None of these swaps are villains on their own. Cost pressure late in a project is real, insurance and supply chains are real, and sometimes the low carbon option genuinely is not buildable in the time available. The problem is not that substitutions happen, it is that they happen without anyone rerunning the numbers against the target signed off at Stage 2. A quantity surveyor sitting in that value engineering meeting is often the one person with both the authority and the paperwork to ask the question before the instruction goes out.
Try it: the sign off simulator
Tick each box the way you actually would in a value engineering meeting. Watch what happens to the answer.
0 of 5 checked. Most value engineering swaps clear none of these.
Still ticking boxes, or not sure where to start checking? A 15 minute call usually closes the gaps faster than a back and forth over email.
Where a platform actually earns its keep here
What do all three swaps have in common? A comparable, verified number that never made it into the room before the instruction went out. That is the specific gap 2050 Materials was built to close, and it maps onto these three swaps more directly than most tools do.
🧱 For the structural frame and cement swaps: the platform’s product database runs to over 192,000 items backed by environmental product declarations, searchable and comparable side by side, which is exactly the like for like check both of those callout boxes ask for.
🏗️ For the facade swap: the Embodied Carbon Optimizer tool was built for precisely this scenario. It lets a QS or design team swap components in a facade or roof buildup and see the carbon consequence of that single change immediately, rather than waiting for a Stage 6 as built assessment to reveal it. Feed it the swap being proposed in the value engineering meeting, not the swap that already happened on site.
🔗 For QS teams who live inside their cost software: 2050 Materials makes its carbon rate libraries available through an API, and through a direct partnership with RIB Software, that same data is built into CostX itself, so a carbon check on a proposed substitution can sit next to the cost check rather than in a separate tool. Turner and Townsend have taken a similar approach, folding the data directly into their own Embodied Carbon Calculator. Getting API access does mean registering for a free token first, but for teams already working inside CostX or a comparable tool, the carbon numbers show up right where the cost numbers already live. Here is how they did it.
Sources referenced in this article
On the impact of each swap
- The impact of value engineering on embodied greenhouse gas emissions in the built environment, ScienceDirect
- Robati and Oldfield (2022), The embodied carbon of mass timber and concrete buildings in Australia: an uncertainty analysis, Building and Environment
- What is evoBuild low carbon GGBS, Heidelberg Materials UK (environmental product declaration figures)
- Integrated BIM LCA optimisation for decarbonising curtain wall facades, Building Research and Information
- Embodied carbon in curtain walls, Make Architects
- Embodied Carbon Primer, London Energy Transformation Initiative (LETI)
On how often each swap actually happens
- Newham hires architect to replace timber with concrete on dRMM scheme, The Architects’ Journal, 2020
- Written evidence from the Timber Accelerator Hub, UK Parliament Environmental Audit Committee, 2021
- Mass Timber Forum for Commercial Offices, Gardiner and Theobald
- Concrete shortage looms for major projects, New Civil Engineer
- New cement crucial to solving Britain’s construction crisis, University of Dundee
- Five ways to maximize the value of value engineering, American Institute of Architects
On the 2050 Materials tools referenced in the closing section
- Discover the Embodied Carbon Optimizer tool for building assemblies, 2050 Materials
- Embodied Carbon Optimiser Tools documentation, 2050 Materials
- RIB Software and 2050 Materials partnership announcement (CostX integration), RIB Software
- Case study: Turner & Townsend partners with 2050 Materials to strengthen cost and carbon intelligence
On process and targets
Related articles
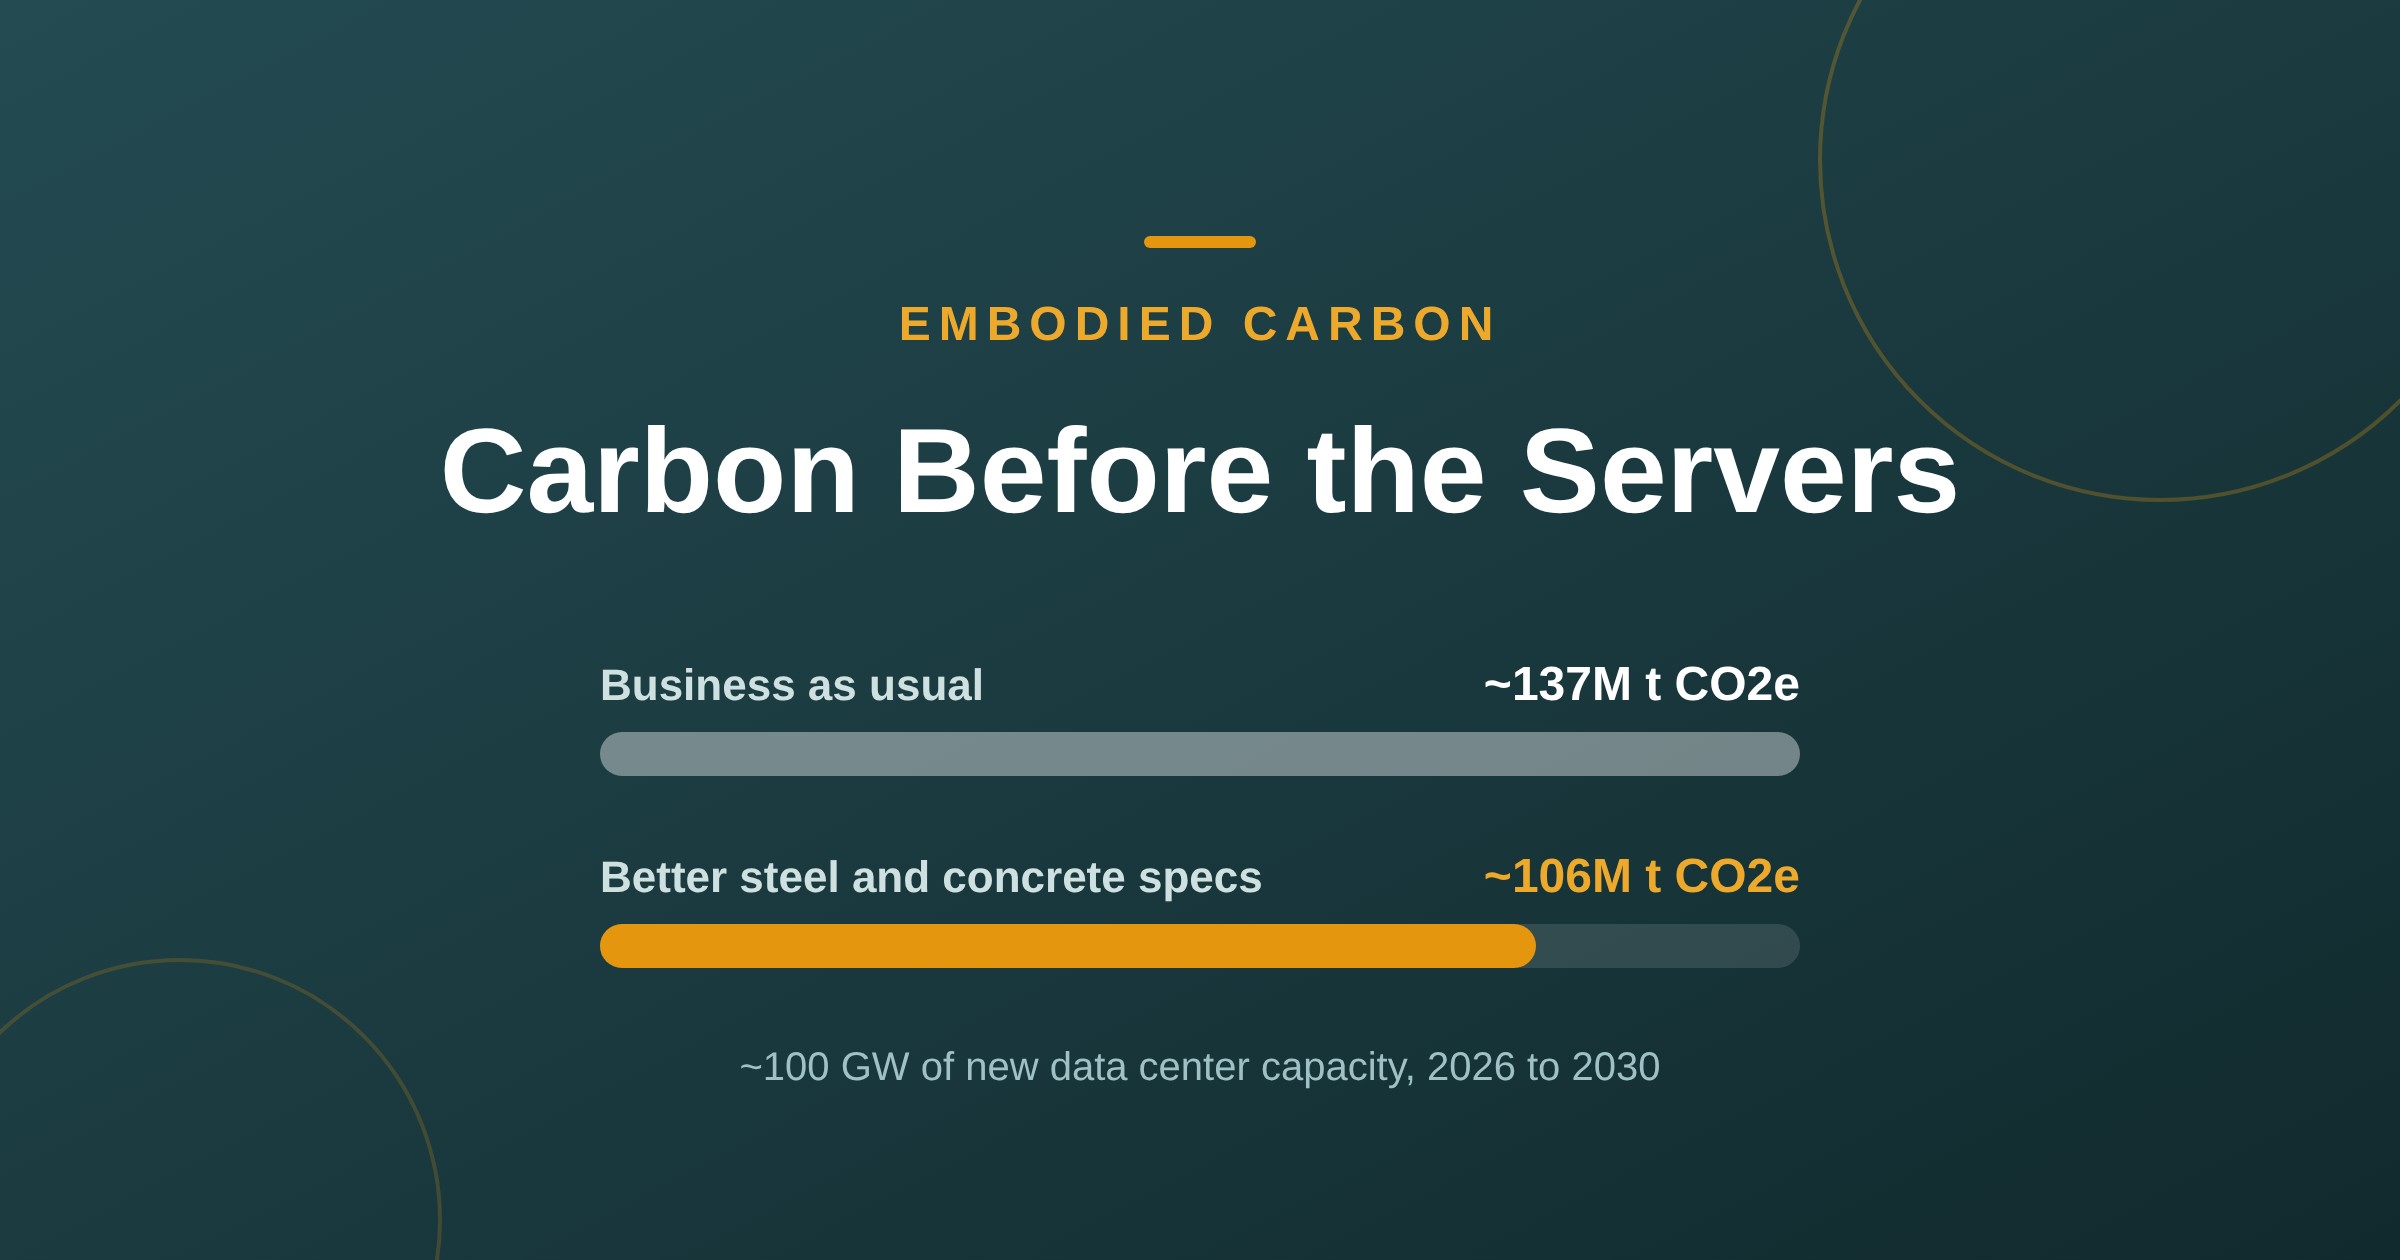
Data Centers’ Hidden 137M-Tonne Carbon Bill
New data centers could lock in ~137M tonnes of CO2e before a single server switches on. GGBS concrete and recycled steel could cut about 31M of it.
Read more
Built to Beat the Heat
This summer's drought wasn't a fluke, it was a preview. Here's the material data that actually decides whether a building shrugs off a heatwave or quietly cooks behind a great winter U value: decrement delay, solar reflectance, SHGC, and the real products behind each one.
Read more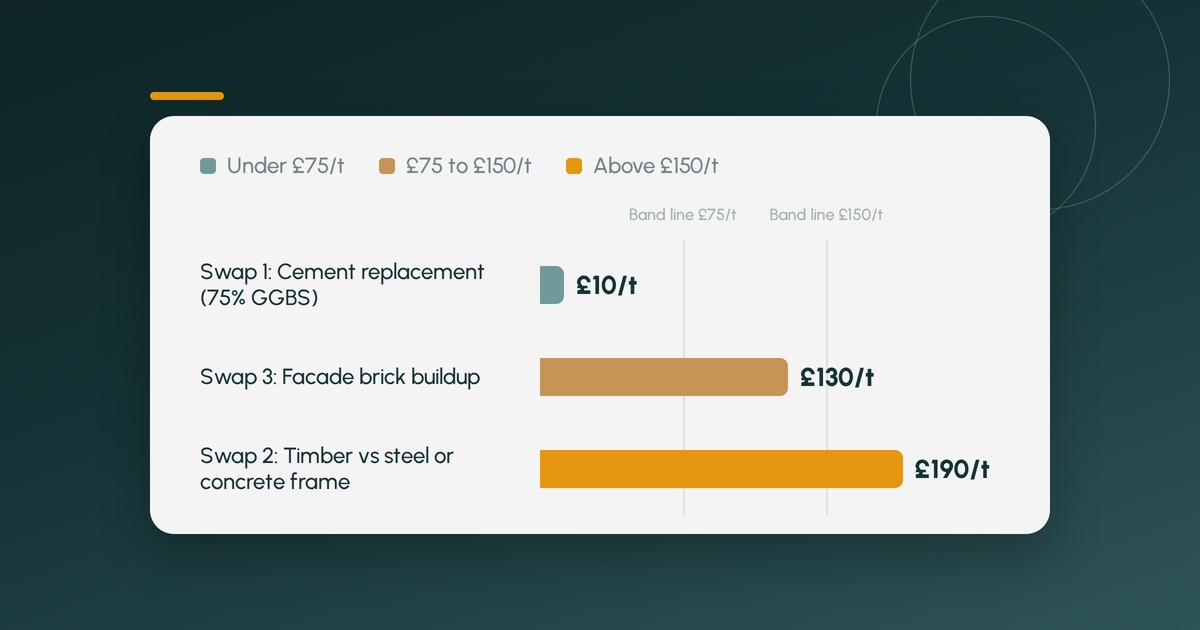
The Cost per Tonne Test for Embodied Carbon Swaps
Not every embodied carbon cut is worth paying for. Test any swap on cost per tonne of CO2e, see which band it falls in, and try the free calculator.
Read more