
Reading Between the EPD Lines

The Fine Print in EPDs
Two Environmental Product Declarations can report almost the same A1 to A3 carbon figure and still deserve very different levels of trust. The headline number is only as good as the assumptions holding it up, and most of those assumptions sit in methodology pages, footnotes and data quality tables that few specifiers ever read.
That matters more every year. EPDs now feed embodied carbon targets, tender requirements, green building credits and procurement rules. A number that was once a marketing extra is becoming a contractual figure, which makes the fine print behind it a commercial question as much as a technical one.
At 2050 Materials, we work with EPD data every day, collecting, structuring and comparing declarations from manufacturers so that designers and specifiers can use them in real decisions. The pattern is consistent: the products that look best on paper are not always the ones with the strongest evidence behind them.
This article walks through the assumptions that point to a high or low confidence EPD, then looks closely at three areas where reading carefully pays off most: compliance with the governing standards, how purchased electricity is modelled, and whether the EPD describes your exact product, a family of products or an industry average.
How Much Was Measured, and How Much Was Borrowed?
Confidence comes down to one question: how much of the result was measured at the factory, and how much was estimated or taken from a database? Even a well made EPD carries uncertainty. The Construction Products Association puts the minimum uncertainty in an A1 to A3 GWP total at roughly ±10%, so small gaps between two products rarely mean much on their own. As we argued in Garbage In, Garbage Out, any carbon calculation is only as good as the data going into it, and that starts with the EPD.
Figure 1
Eight assumptions that set an EPD’s confidence level, and what each looks like at either end.
Primary versus generic data
EN 15804 expects specific data for every process the manufacturer controls.
Metered energy, real raw material quantities and measured waste from the plant
Database averages standing in for the factory’s own operations
Reference year and data age
Producer data should come from the last five years, generic background data from the last ten.
A stated, recent 12 month collection period
Old plant data, or no reference year given
Background database
The LCA software and database, such as ecoinvent or Sphera, and their versions should be named.
Regional datasets for key inputs like cement, steel or resin
Global averages, or no database version stated
Upstream suppliers
Most EPDs model purchased materials with generic data, which matters most when one input dominates.
Supplier specific data for the biggest input, such as clinker or aluminium
Generic data for an input that drives most of the result
Cut off and exclusions
EN 15804 allows inputs under 1% of mass and energy per process to be left out, up to 5% in total.
Exclusions listed and justified
Packaging, ancillaries or equipment quietly missing
Allocation
Where a plant makes several products, or uses slag, fly ash or scrap, the method of splitting impacts can move the result a lot.
Method stated and justified
No explanation of how shared impacts were split
Modules declared
Under EN 15804+A2, A1 to A3, C1 to C4 and D are mandatory for most products.
Full life cycle modules reported
Cradle to gate only, with no reason given
Uncertainty
Good EPDs say which assumptions matter most and how much the result could move.
Sensitivity analysis or a stated variation range
Results to five significant figures with no comment
Source: EN 15804+A2 and the Construction Products Association, EPD uncertainty: a technical review (2024).
None of these on its own makes an EPD unreliable. What they do is tell you how much weight a number can carry. An EPD with metered plant data, a recent reference year and a clear sensitivity analysis can support a hard comparison. One built mostly on generic data is closer to an informed estimate. And while this article focuses on carbon, the same assumptions shape every other indicator in the declaration, from acidification to resource use, which we unpacked in What Else Is in an EPD Beyond Carbon, Anyway?
Compliance Is the First Filter
An EPD is only comparable with another if both follow the same rules, so compliance is the baseline for trust rather than a formality. The standards landscape is crowded, as we explored in Comparing EPD Data Standards, but five things are worth checking on the cover page and in the verification statement before reading any results.
Governing standards
ISO 14025 plus EN 15804+A2 in Europe and the UK, or ISO 21930 in North America and several other markets. An EPD still on EN 15804+A1 uses older impact methods and fewer mandatory modules, so its figures are not directly comparable with A2 results.
Product Category Rules
The PCR name, version and programme should be stated, and the PCR should be current and specific to the product. Two EPDs built on different PCRs can apply different boundaries and scenarios to the same material.
Programme operator
A recognised operator such as EPD International, IBU, BRE, UL Environment or EPD Norge, with the EPD listed in its public registry.
Independent verification
A named, external verifier. Internal review is allowed in some cases but carries less weight, and LEED v4.1 reflects this: a product specific EPD with external verification and external critical review counts as 1.5 products, while an internally reviewed one counts as 1.
Validity
EPDs are normally valid for five years. One issued in the last two or three years is a good sign; one close to expiry may describe a process that has since changed.
If any of these are missing, treat the numbers as indicative only, and avoid using them in a formal comparison or a tender requirement.
The Electricity Question
The physical electricity a factory takes from the grid is the same however it is bought. An EPD can still model it as renewable by applying energy attribute certificates: REGOs in the UK, Guarantees of Origin in the EU, I‑RECs internationally and RECs in the US.
Applying them can take the electricity emission factor from roughly 0.2 to 0.5 kg CO2e per kWh down to near zero. For electricity intensive products such as aluminium, glass, mineral wool, tiles or engineered panels, that can move the A1 to A3 result materially, sometimes more than any change to the product itself.
Figure 2
What a certificate does to the electricity factor in an EPD, and what it costs.
kg CO2e per kWh. The typical grid electricity factor, and the factor once certificates are applied.
Bundled
Certificates that come with the power itself, through a power purchase agreement, a direct wire supply or on site generation. The manufacturer is paying for renewable generation to exist.
Unbundled
Certificates bought separately from the power. They are cheap, and buying them does not mean any extra renewable power reached the factory or the grid.
Source: Cornwall Insight, The rise and fall of REGO prices; typical grid factors vary by country and year.
At under £1 per MWh, a plant can make its electricity look renewable for a fraction of a penny per kWh, without changing anything about where its power comes from.

On site generation is the strongest form of renewable claim. H.G. Matthews’ new 300kW solar PV array at The Brickworks, Bellingdon.
The contrast is clearest when a manufacturer invests in generation itself. In H.G. Matthews: Beyond the EPD, we looked at how the brickmaker’s new 300kW solar PV array at Bellingdon cuts its reliance on grid power directly, and how improvements like this can feed into future EPD updates. That is a very different claim from buying certificates at under £1 per MWh.
Programme rules are starting to respond. Practice still varies between programme operators, and some do not allow Guarantees of Origin at all. EPD Norge now requires new EPDs to report foreground electricity both ways: market based, with certificates, and location based, using the grid average. They must also state the GWP per kWh used and name the certificates and their validity period. If certificates lapse and GWP worsens by more than 10%, the EPD becomes invalid.
When you read an EPD for an electricity intensive product, look for five things: the electricity factor in kg CO2e per kWh, whether certificates were applied and of which type, whether they are bundled or bought separately, a residual mix rather than a grid average for any uncovered electricity so the same renewable output is not counted twice, and ideally a location based result alongside the market based one.
Industry, Product Group or Product Specific?
The type of EPD tells you how closely its numbers match the product that actually arrives on site. All three types are legitimate. They simply answer different questions.
Figure 3
The three types of EPD, what each describes, and how far it can be trusted for one specific product.
Industry EPD
An average across several manufacturers in a region, usually published by a trade association.
Best for: early design estimates and benchmarking
Product group EPD
Several similar products from one manufacturer, sometimes across several plants.
Best for: comparing manufacturers before the exact product is fixed
Product specific EPD
One product, ideally from one named plant.
Best for: procurement, carbon targets and final comparisons
| EPD type | What it covers | Best used for | Confidence for one product |
|---|---|---|---|
| Industry EPD | An average across several manufacturers in a region | Early design estimates and benchmarking | Low |
| Product group EPD | Several similar products from one manufacturer | Comparing manufacturers before the exact product is fixed | Medium, depending on the declared variation |
| Product specific EPD | One product, ideally from one named plant | Procurement, carbon targets and final comparisons | High, if the plant can be identified |
Source: International EPD System rules via One Click LCA, and the Construction Products Association.
Industry EPDs are useful early on, but the best and worst producers inside the average can sit well apart. Under the International EPD System, a sector EPD must report any GWP variation above 10% between participating companies with an explanation, and its results cannot be presented as representative of any one manufacturer.
Product group EPDs can declare a volume weighted average, a representative product or a worst case result, and the cover page should say which. For ISO 21930 compliance, results must not vary by more than 10% between the included products; otherwise each indicator that varies by more than 10% must be declared, along with the GWP range. A worst case declaration is conservative. An average can flatter the heavier products in the range.
Product specific EPDs carry the most weight, but only if you know which plant your product comes from. Results averaged across several sites cover a broader spread of performance than single site results, so comparing one with the other can mislead.
A1 to A3 emission ranges per kg of steel products by country, based on EPDs collected by 2050 Materials. Use the chart’s Download image link for a full resolution copy. From Data Insights: Embodied Emissions of Steel Across Different Countries.
Our own data shows why this matters. When we mapped EPDs for steel products across countries, the spread was wide not only between countries but within them. An industry average for any one of those markets would hide exactly the difference a specifier is trying to find.
On the platform
Browse product specific EPDs from named manufacturers, like those in our collection of bricks with EPDs, and compare them side by side.
Who Should Read the Fine Print
This is not only a job for LCA specialists.
Architects
Comparing products on A1 to A3 alone can reward the best modelled EPD rather than the lowest carbon product.
Sustainability teams
Need to know which figures can support a whole life carbon assessment and which should be flagged as indicative.
Manufacturers
A transparent, well evidenced EPD is a competitive asset, especially as buyers start asking how electricity was modelled.
Procurement and contractors
Should specify the EPD type and standard they will accept, so bids are compared on the same basis.
Recap and What to Do About It
A low carbon figure is only as useful as the assumptions behind it. The strongest EPDs are compliant with current standards, independently verified, built on recent plant data, specific to the product and plant you are buying from, and open about how electricity was modelled.
Before using an EPD to choose a product or set a target, ask three questions. Does it follow the same rules as the EPDs you are comparing it with? Does it describe this product, from this plant? And if its electricity is near zero carbon, is that backed by new renewable supply or by cheap certificates?
Checking all of this by hand, one PDF at a time, does not scale across a whole project. That is why the 2050 Materials Sustainability Data API collects and structures this fine print for more than 200,000 EPDs: the governing standard, PCR, programme operator and verification, reference year and validity, and whether an EPD is industry average or product specific. Instead of comparing headline figures, you can filter EPDs by the quality of the data behind them, directly inside your own tools, dashboards and carbon calculators.
Sustainability Data API
Filter EPDs by quality, not just carbon.
The 2050 Materials API collects and structures the data behind 200,000+ EPDs, so you only work with figures you can trust.
References:Construction Products Association, EPD uncertainty: a technical review (2024); EPD Norge, Guidelines on use of electricity and biogas certificates (2025); Cornwall Insight, The rise and fall of REGO prices; One Click LCA, Rules for EPDs of multiple products; One Click LCA, LEED v4.1 EPD credits.
Related reading
 From the archive · Mar 2024Comparing EPD Data Standards, and an Opinion on the Way ForwardHow the growing number of EPD data standards line up, and what a more consistent approach could look like.Read more
 From the archive · Feb 2024What Else Is in an EPD Beyond Carbon, Anyway?The indicators in an EPD that are often overshadowed by the focus on carbon, and why they matter.Read more
 Collections · Apr 2026The Most Interesting Brick Products with EPDs on the 2050 Materials PlatformEarth based, handmade, reclaimed and clay bricks with published EPDs, all searchable on the platform.Read more
Related articles
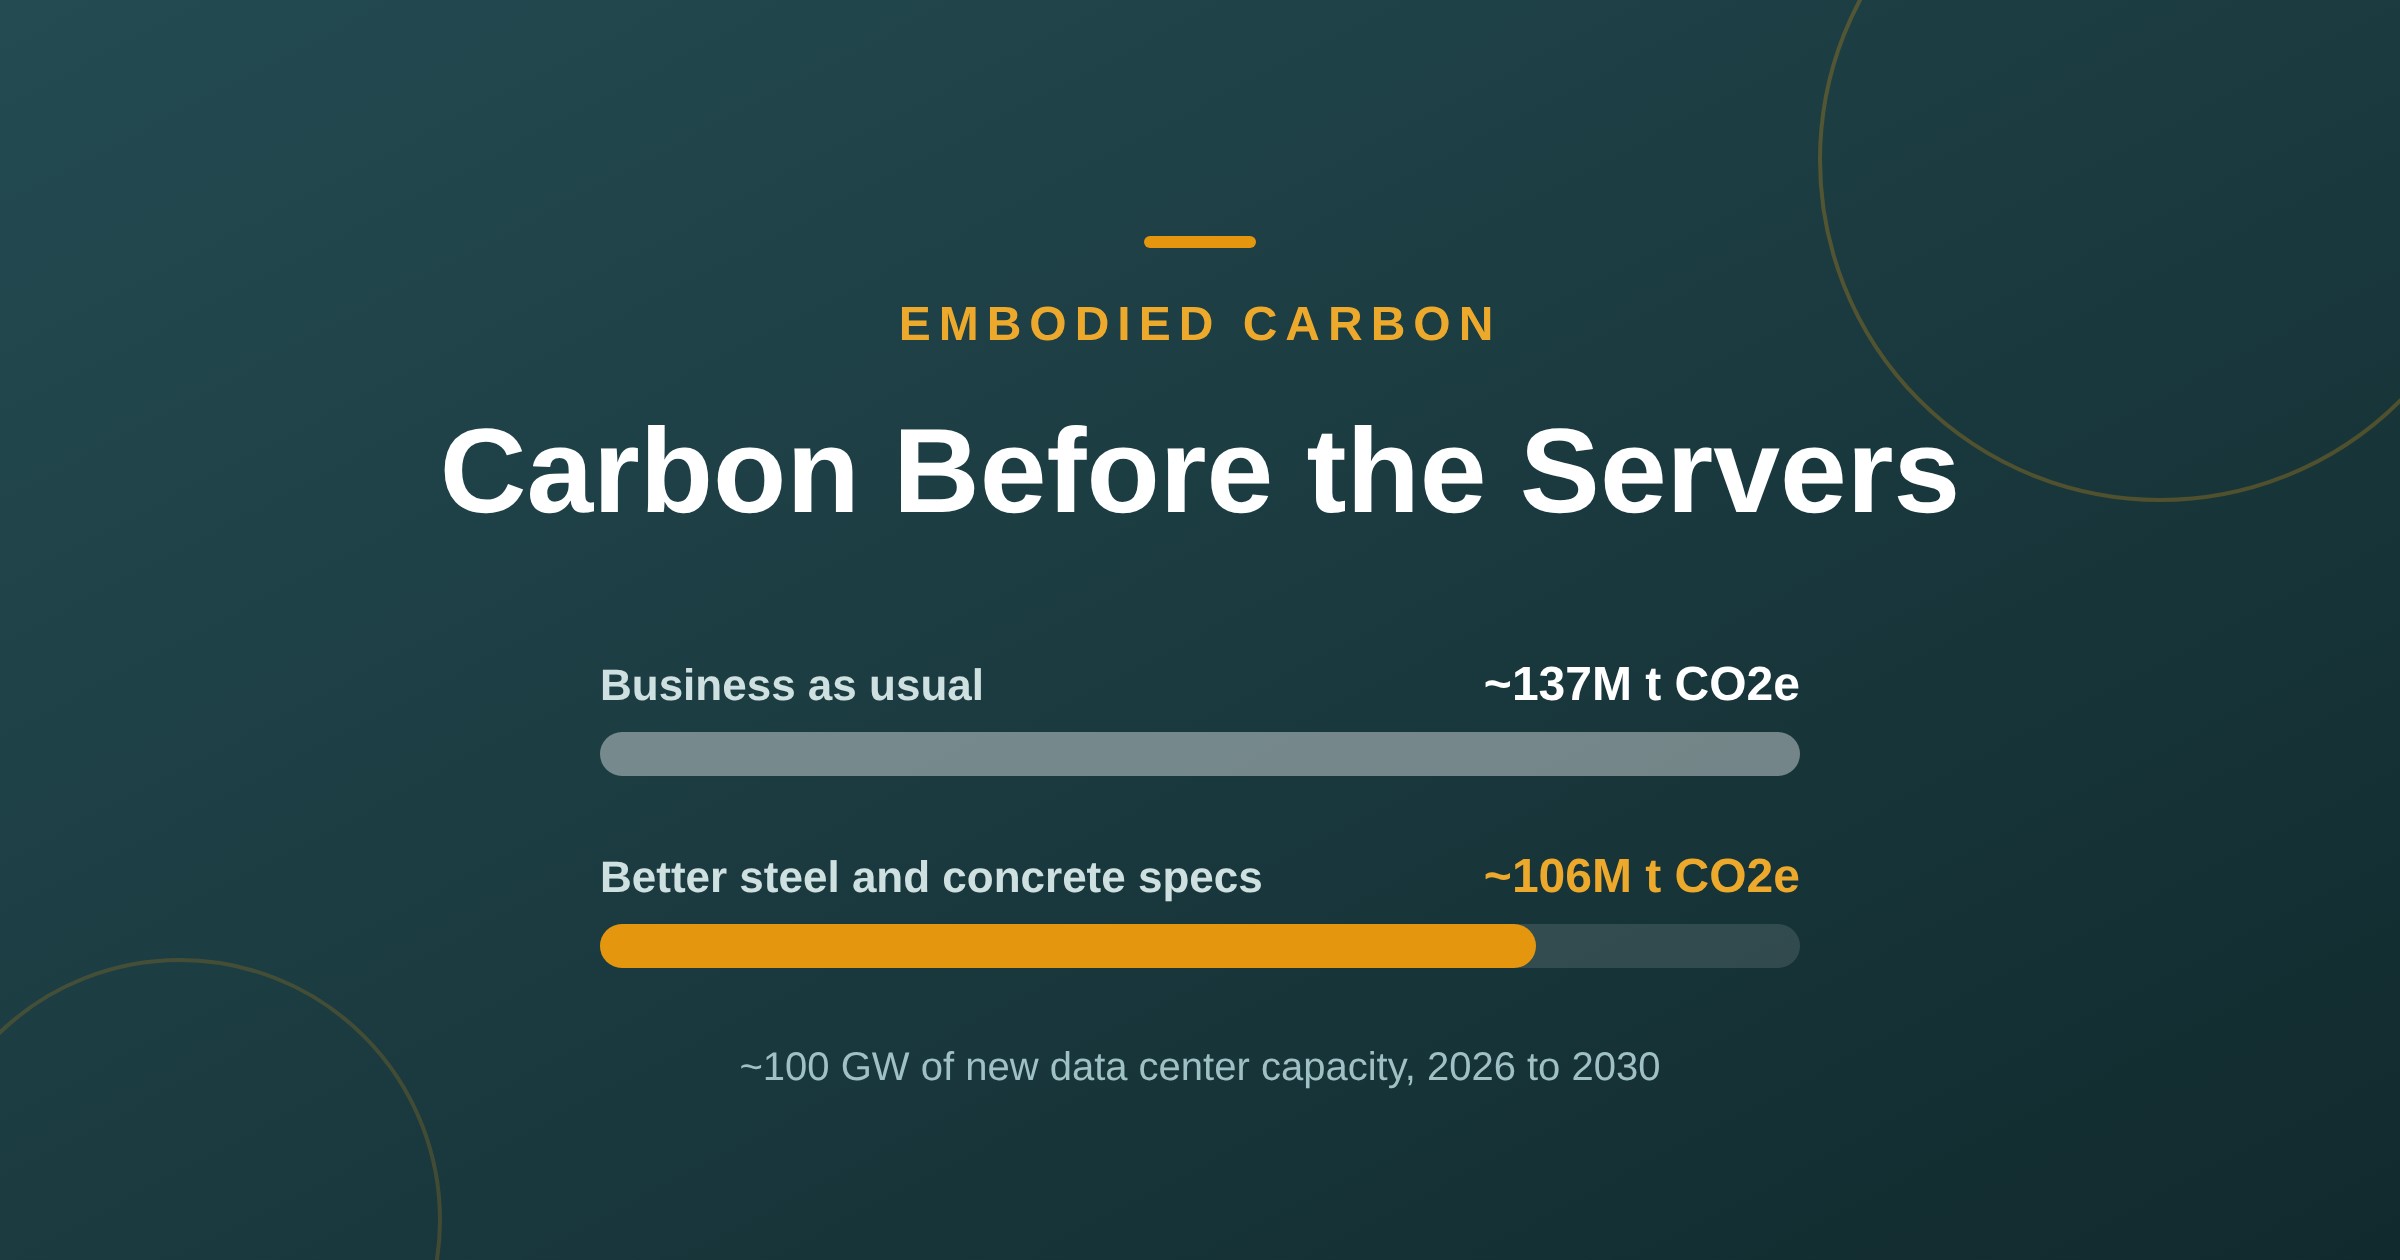
Data Centers’ Hidden 137M-Tonne Carbon Bill
New data centers could lock in ~137M tonnes of CO2e before a single server switches on. GGBS concrete and recycled steel could cut about 31M of it.
Read more
Built to Beat the Heat
This summer's drought wasn't a fluke, it was a preview. Here's the material data that actually decides whether a building shrugs off a heatwave or quietly cooks behind a great winter U value: decrement delay, solar reflectance, SHGC, and the real products behind each one.
Read more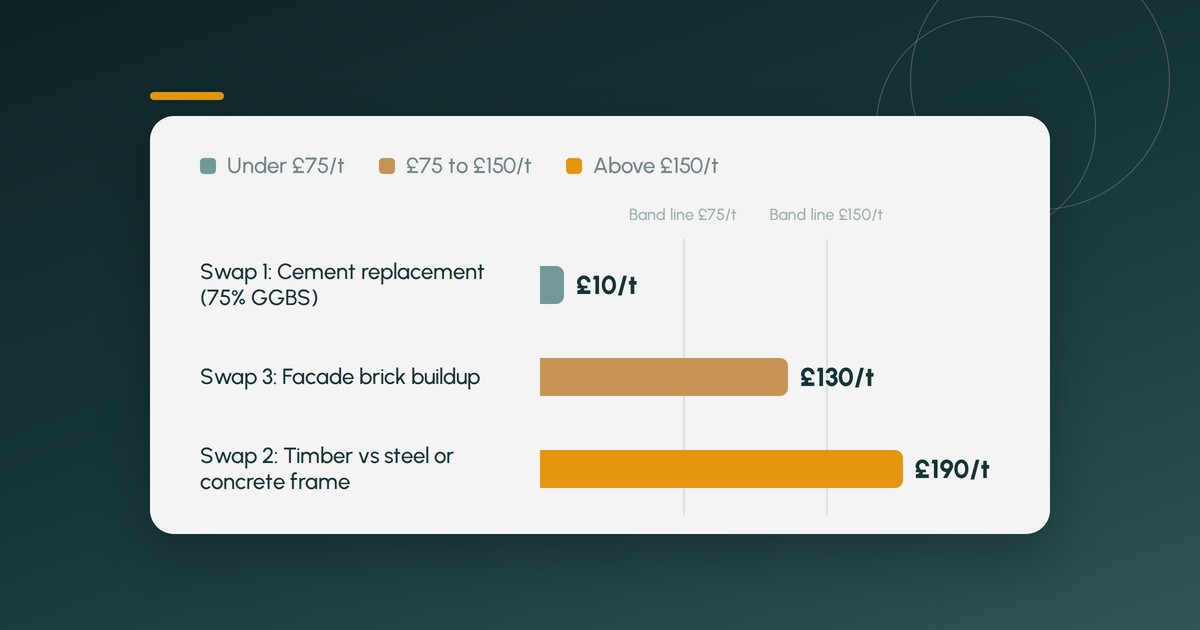
The Cost per Tonne Test for Embodied Carbon Swaps
Not every embodied carbon cut is worth paying for. Test any swap on cost per tonne of CO2e, see which band it falls in, and try the free calculator.
Read more